Figure 3.

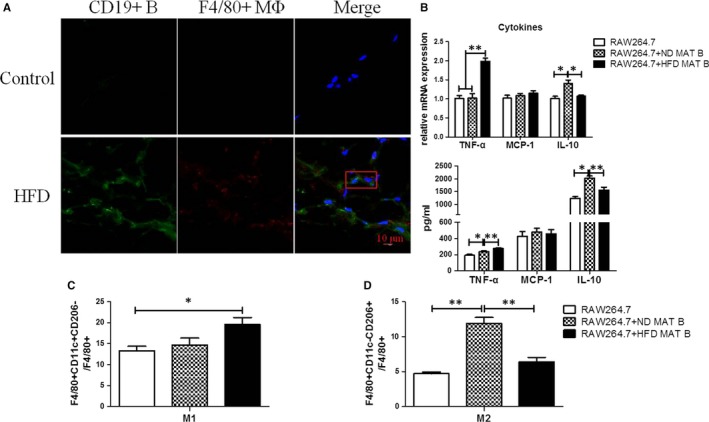
Infiltrated B lymphocytes might relate to macrophage inflammation and their differentiation into M1 macrophage. A, The representative immunofluorescence staining of MAT of HFD‐fed mice for 12 wk. The scale bar represents 10 μm. The red rectangle includes a macrophage and an adjacent B cell. B, The proportion of F4/80+CD11c+CD206− M1 and F4/80+CD11c−CD206+ M2 macrophages in the co‐culture system of RAW264.7 macrophages and MAT B lymphocytes, either from normal diet (ND)‐ or HFD‐fed mice. C, The relative mRNA expression of inflammatory cytokines in macrophages of the co‐culture system, specifically, TNF‐α, MCP‐1 and IL‐10. D, The levels of cytokines in cultural supernatants of the RAW264.7 macrophages and MAT B cells co‐culture system, specifically, TNF‐α, MCP‐1 and IL‐10. Values represent means ± SEM, *P < 0.05, **P < 0.01. HFD, high‐fat diet; IL, interleukin; MAT, mesenteric adipose tissue; TNF, tumour necrosis factor
