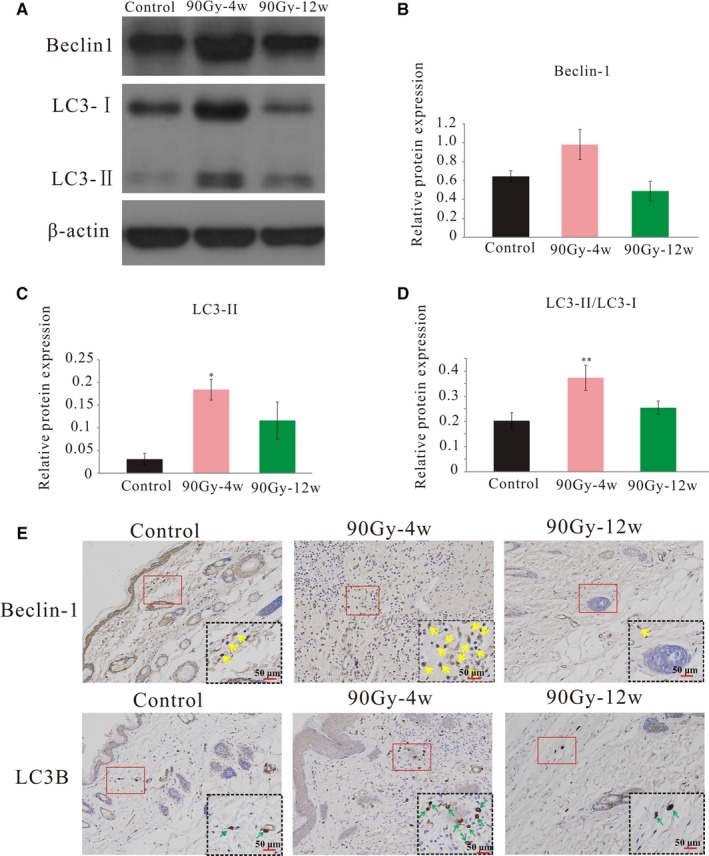
Figure 6.

Radiation activated autophagy in the skin tissue. A, Representative blots of LC3I/II and Beclin‐1 detected by western blot, β‐actin was used as a loading control. B‐D. Protein expression level analysis. E, Representative immunohistochemistry images were shown with staining for LC3B and Beclin‐1. Yellow arrows indicated Beclin‐1 positive expression. Green arrows indicated LC3B positive expression. The results are expressed as the mean ± SEM. *P < 0.05, **P < 0.01 compared with control group
