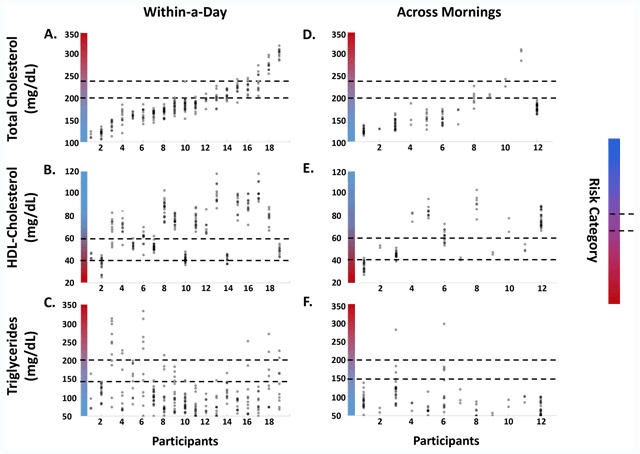
Figure 2.

Within and Across Day Lipid Variability Traverses CVD Risk Categories. The daily and across morning ranges of TC, HDL-c, and triglycerides carry many individuals across CVD risk categories. Gradient indicates risk category, with redder as higher risk. Lines indicate risk category boundaries. Data shown are scatters by individual of TC, HDL-c and triglyceride values taken within a single day (A–C), and fasted within a single morning on different days, between 06:00 and 08:00 (D–F). Individuals are sorted from low to high range in TC, and this sorting is maintained in all plots. In total, 100% of individuals cross a risk category in as least one output at one or more time points within a day (A–C). 90% crossed at least one risk category in one output across days (D–F). Forty-seven percent of individuals cross at least one risk category in TC (A) and HDL-c (B) within a day. (C) Seventy-four percent of individuals cross at least one risk category for triglycerides. (D) Fasted between 6–8 am, 15% of individuals cross a TC risk category. (E–F) Thirty-six percent crossed an HDL-c or triglyceride risk category.
