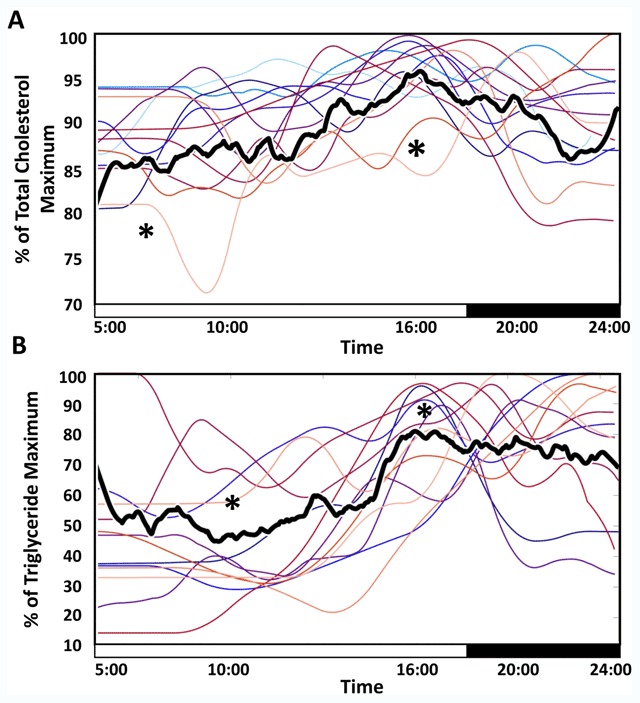
Figure 3.

Median Total Cholesterol and Triglycerides Show Significant Daily rhythms. Median of all individuals’ percent of maximum TC (A) and triglycerides (B) by time of day show significant sine fit at approximately circadian periodicity, and significant change from fit peak to trough. Two-hour moving means of individual profiles are shown in color for ease of visualization. TC and triglycerides reached a maximum around 16:00, with minima in the early to mid-morning. The median percent change from maximum to minimum was 40% for TC and 35% for triglycerides. * indicate significant difference between peak and trough distributions (5:00–7:00, and 15:00–17:00 in TC and 9:00–11:00 and 16:00–18:00 in triglycerides) (Kruskal-Wallis p = 3.41*10–41 and p = 2.11*10–30). Sine fit statistics and plots of individual data and fits are available at our Open Science Foundation page.
