
Figure 3.
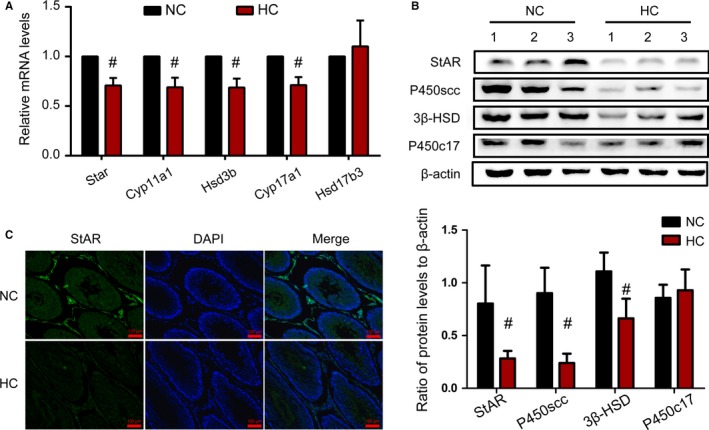
Expression of steroidogenic enzymes decreased by the HC diet in Leydig cells. By quantification with real time PCR analysis and normalization to β‐actin levels in the testis, relative mRNA levels of Star, Cyp11a1, Hsd3b, Cyp17a1 and Hsd17b3 are shown compared with those in the NC group (A). Protein expression of StAR, P450scc, 3β‐HSD and P450c17 was measured by western blotting, with relative protein abundance analysis (B). Representative images of immunofluorescence staining performed in the testicular Leydig cell for StAR, which is a key enzyme in steroidogenesis (C). Data were expressed as the mean ±SEM (n = 8 per group). #P < 0.05 vs the NC group. All results were from at least three independent experiments