
Figure 4.
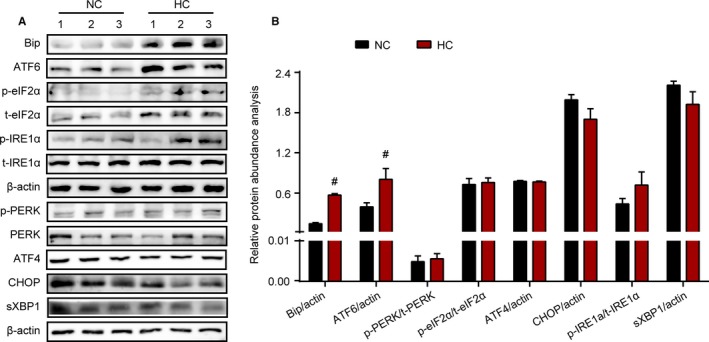
Enhanced ER stress participated in the process of HC diet‐induced testicular dysfunction. Representative protein expression for BiP, p‐PERK, total‐PERK (t‐PERK), p‐eIF2α (at Ser51), total‐eIF2α (t‐eIF2α), p‐IRE1α (at Ser724), total‐IRE1α (t‐IRE1α), sXBP1, CHOP, ATF4 and ATF6 was measured by western blotting in both treated groups (A). Relative protein density between p‐PERK and t‐PERK, p‐eIF2α and t‐eIF2, p‐IRE1α and t‐IRE1α, BiP, sXBP1, CHOP, ATF4, ATF6 and β‐actin was analysed (B). Data were expressed as mean ±SEM (n = 8 per group). #P < 0.05, ##P < 0.01 vs the NC group. All results were from at least three independent experiments [Colour figure can be viewed at wileyonlinelibrary.com]