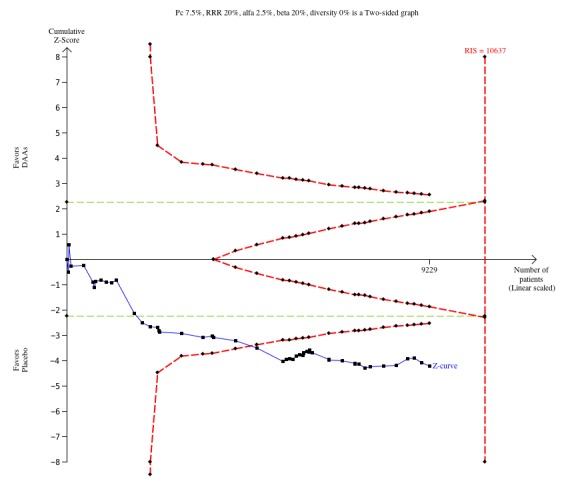
Figure 6.

Trial Sequential Analysis of the effects of withdrawn direct‐acting antivirals versus placebo or no intervention on risk of serious adverse events. The analysis was based on a proportion in the control group (Pc) of 7.5%, a RRR of 20%, and alfa of 2.5%, a beta of 20%, and a diversity of 0%. After randomisation of about 5000 participants, the cumulative Z‐curve crosses the trial sequential monitoring boundary for harm.
