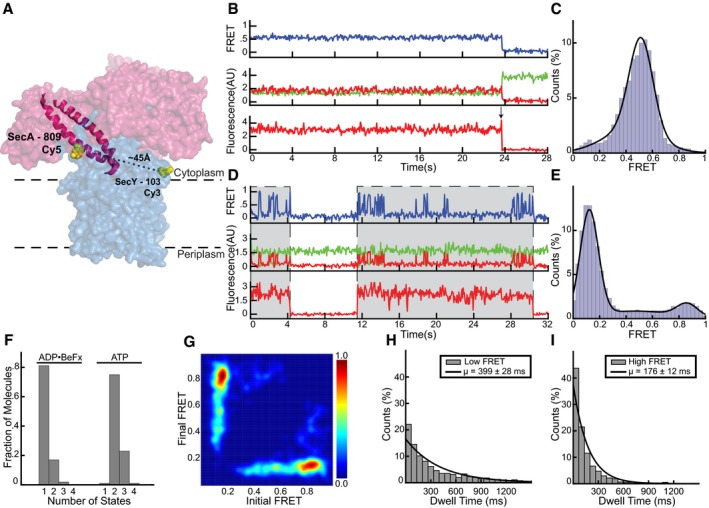
Figure EV2. SecA's two‐helix finger movements observed by alternative fluorophore positions.

- Cy5 and Cy3 fluorophores were introduced into the two‐helix finger of SecA (PDB 3dIN; red space filling model; helices highlighted) at position 809 and into SecY (blue) at position 103, respectively.
- Representative traces obtained with ADP•BeFx. The upper FRET trace was calculated from the middle traces obtained by exciting the donor fluorophore and measuring both donor (green) and acceptor (red) fluorescence. The lowest trace was obtained by exciting the acceptor fluorophore directly. The arrow indicates a bleaching event.
- Distribution of FRET values determined from 106 traces as in (B), fit with a Gaussian model (black curve).
- As in (B), but in the presence of ATP. Periods in which a fluorescently labeled SecA molecule is bound are indicated by gray shading.
- As in (C), but with ATP (200 traces).
- Traces obtained in the presence of different nucleotides were used to determine the number of states best fit by the Markov model.
- Transition density plot of idealized ATP FRET states obtained in (F).
- The distribution of dwell times of the low FRET states observed in ATP was fit with exponentials (1,172 low FRET states). The inset shows average dwell time and error, defined as the standard error based on the number of traces.
- As in (H), but with high FRET (1,349 high FRET states).
Source data are available online for this figure.
