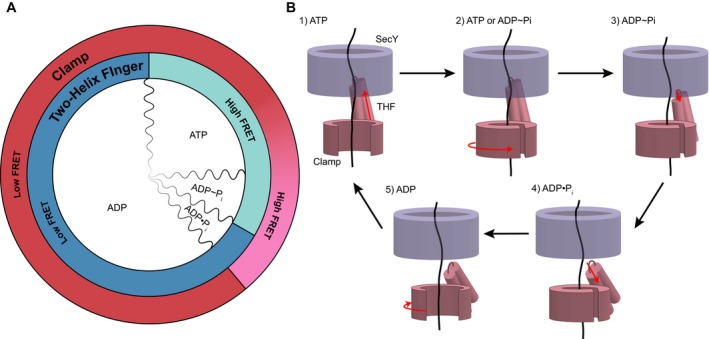
Figure 5. Power‐stroke model for polypeptide translocation by SecA.

- Alignment of observed FRET states with the ATP hydrolysis cycle. Two‐helix FRET states are depicted in shades of blue and clamp states in shades of red. The red gradient from low to high FRET indicates uncertainty as to the precise point of clamp closure. The subdivisions of ATP hydrolysis (wavy lines) are meant to indicate qualitative, rather than quantitative, durations of the hydrolysis steps. ADP˜Pi indicates the transition state of ATP hydrolysis.
- SecY is shown in blue and SecA domains in pink (THF, two‐helix finger). Domain movements are indicated by red arrows. Clamp closure occurs either during ATP binding or hydrolysis. See text for details.
