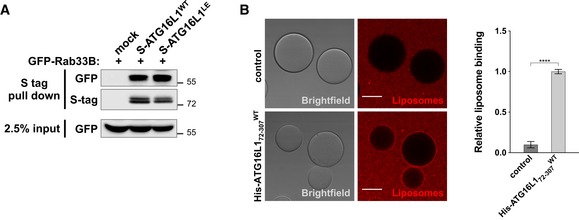
Figure EV3. Microscopy‐based liposome binding assay using His‐ATG16L172–307 WT .

- Protein–protein interaction assay in 293T cells transiently transfected with the indicated Flag‐S‐tagged ATG16L1 constructs and GFP‐Rab33B. S tag pull‐down was performed, and protein complexes were analysed by immunoblotting using the indicated antibodies.
- Microscopy‐based protein–liposome binding assay. His‐ATG16L172–307 WT immobilised on His beads or His‐beads alone were incubated in the presence of rhodamine‐labelled liposome preparations containing PI3P. Scale bar: 50 μm. The right panel shows quantification of relative liposome binding and depicts means and error bars (SEM) from at least three independent experiments. ****P ≤ 0.0001 (pairwise unpaired Student's t‐test).
