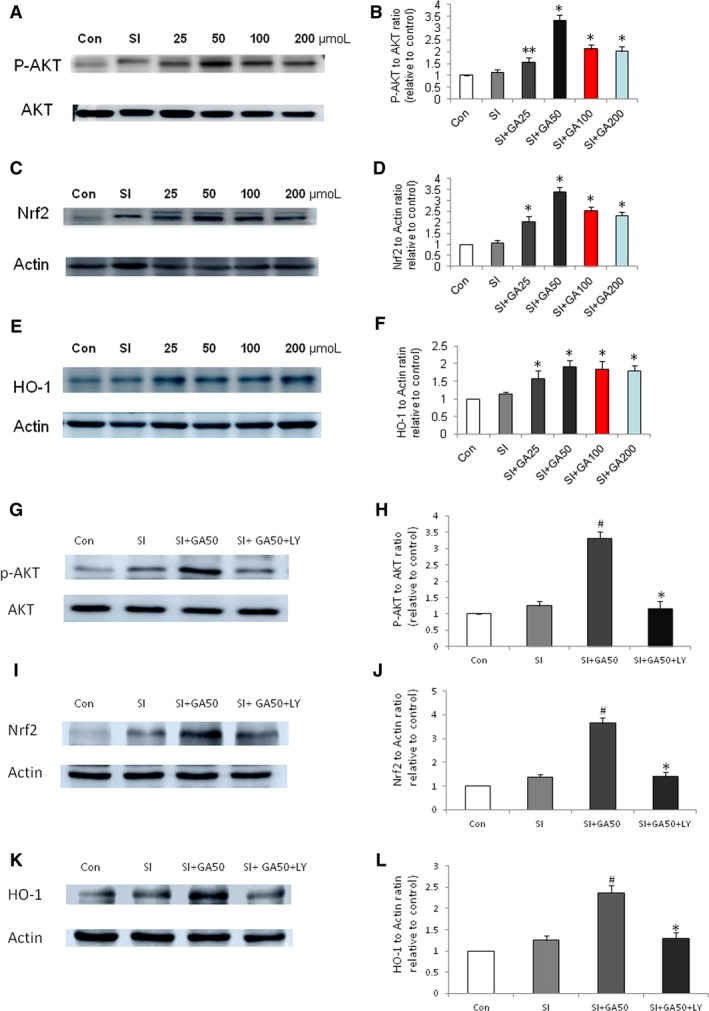
Figure 7.

Effects of glycyrrhizin on the expression of phosphorylation of AKT, Nrf2, and HO‐1 in ARPE‐19 cells treated with sodium iodate (SI) by Western blot detection. A, Effects of glycyrrhizin on phosphorylation of AKT. B, Glycyrrhizin significantly increased the phosphorylation of AKT at a concentrations of 25‐200 μmol (**P < 0.05 vs the SI control, *P < 0.01 vs the SI control). C, Effects of glycyrrhizin on the expression of Nrf2. D, Glycyrrhizin significantly increased the expression of Nrf2 at concentrations of 25‐200 μmol (*P < 0.01 vs the SI control). E, Effects of glycyrrhizin on the expression of HO‐1. F, Glycyrrhizin significantly increased the expression of HO‐1 at concentrations of 25‐200 μmol (*P < 0.01 vs the SI control). G, Effects of PI3K/AKT inhibitor LY294002 on phosphorylation of AKT treated with glycyrrhizin. H, Glycyrrhizin significantly increased the phosphorylation of AKT at a concentrations of 50 μmol (# P < 0.01 vs the SI control), while LY294002 significantly decreased the phosphorylation of AKT (*P < 0.01 vs the SI + GA50 control). I, Effects of LY294002 on the expression of Nrf2. J, Glycyrrhizin significantly increased the expression of Nrf2 at concentrations of 50 μmol (# P < 0.01 vs the SI control), while LY294002 significantly decreased the expression of Nrf2 (*P < 0.01 vs the SI + GA50 control). K, Effects of glycyrrhizin on the expression of HO‐1. L, Glycyrrhizin significantly increased the expression of HO‐1 at concentrations of 50 μmol (# P < 0.01 vs the SI control), while LY294002 significantly decreased the expression of HO‐1(*P < 0.01 vs the SI + GA50 control)
