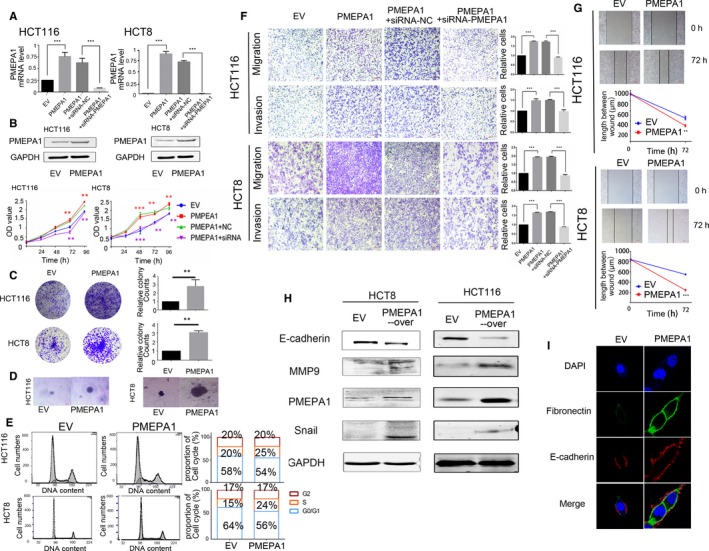
Figure 3.

Prostate transmembrane protein androgen induced 1 (PMEPA1) promotes proliferation and metastasis in colorectal cancer cell lines (A) The efficiency of overexpressed PMEPA1 has been testified by qRT‐PCR and Western blot in HCT116 and HCT8. And the efficiency of siRNA‐PMEPA1 has been testified by qRT‐PCR. B, The proliferation of HCT116 and HCT8 cells with PMEPA1 overexpressed and PMEPA1‐overexpressed+siRNA‐PMEPA1 was detected by CCK8 assay. The * markers in purple colours indicate the statistical analysis is between PMEPA1+NC and PMEPA1+siRNA; the * markers in red colours indicate the statistical analysis is between EV and PMEPA1. (C,D) The proliferation of HCT116 and HCT8 cells with PMEPA1 overexpressed was detected by plate clone assay and soft agar clone assay. E, Flow Cytometer detected the cell cycle and the proportion of each cell cycle. F, Migration and invasion assay have been used for HCT116 and HCT8 cells with PMEPA1 overexpressed and PMEPA1‐overexpressed+siRNA‐PMEPA1.The chambers were washed by 30% acetic and the absorbance of washing solution was recorded at 570 mn for the quantification of the relative migration and invasion cells. G, Wound healing assay has been used for the HCT116 and HCT8 cells with PMEPA1 overexpressed. And the length of the wound has been measured by Image J. The designations for levels of significance were used within this figure: *P < 0.05; **P < 0.01; ***P < 0.001; ns, not significant. H, Western blot detection of E‐cadherin, MMP9, snail and PMEPA1 in HCT116 and HCT8 with PMEPA1 up‐regulation. I, Immunofluorescence assay for expression of E‐cadherin and Fibronectin in PMEPA1 up‐regulated in HCT116 cells. The designations for levels of significance were used within this figure: *P < 0.05; **P < 0.01; ***P < 0.001; ns, not significant
