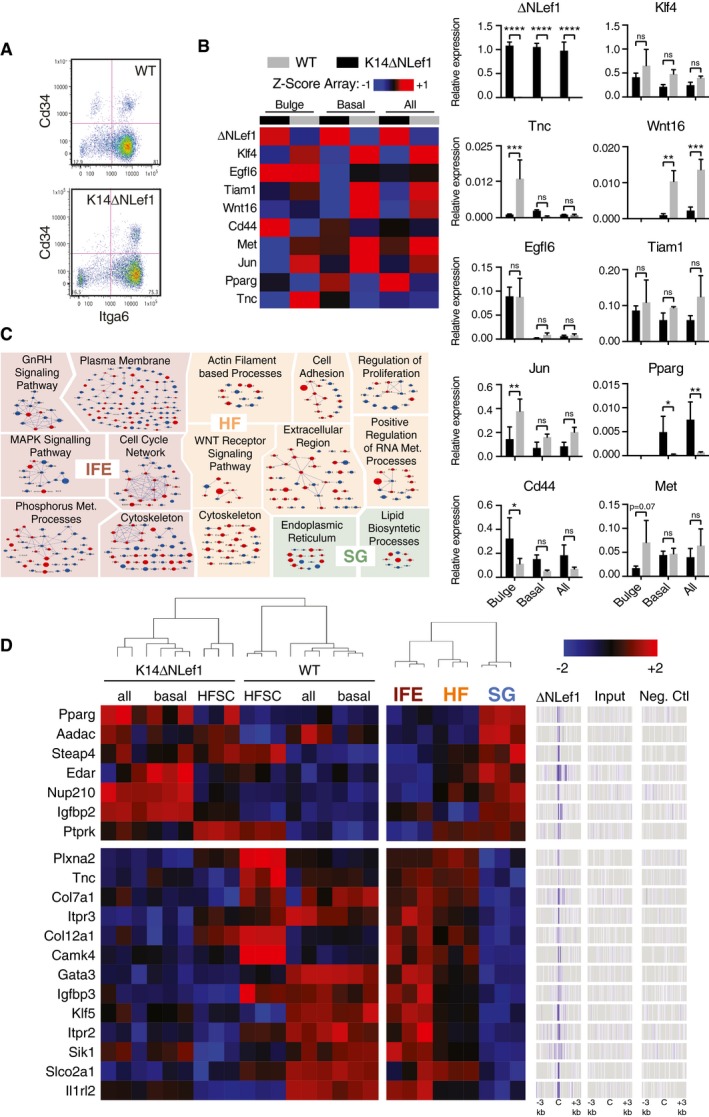
Figure EV1. Validation of transcriptional changes observed in K14ΔNLef1 keratinocytes.

- Flow‐sorting strategy for basal keratinocytes (Itga6+Cd34−) and bulge stem cells HFSC (Itga6+Cd34+).
- Z‐score heat‐map representing DEG between WT‐ or K14ΔNLef1‐sorted all, basal or HFSC keratinocytes. Validation of these results was performed by RT–qPCR. Data are means ± SEM from 3 to 4 mice. (ns) Not significant; *P < 0.05; **P < 0.005; ***P < 0.0005; ****P < 0.00005; ordinary one‐way ANOVA.
- Gene Ontology enrichment analysis and network visualization of DEG in HF vs IFE vs. SG (Donati et al, 2017) and WT vs K14ΔNLef1 keratinocyte expression profiles.
