
Figure 5.
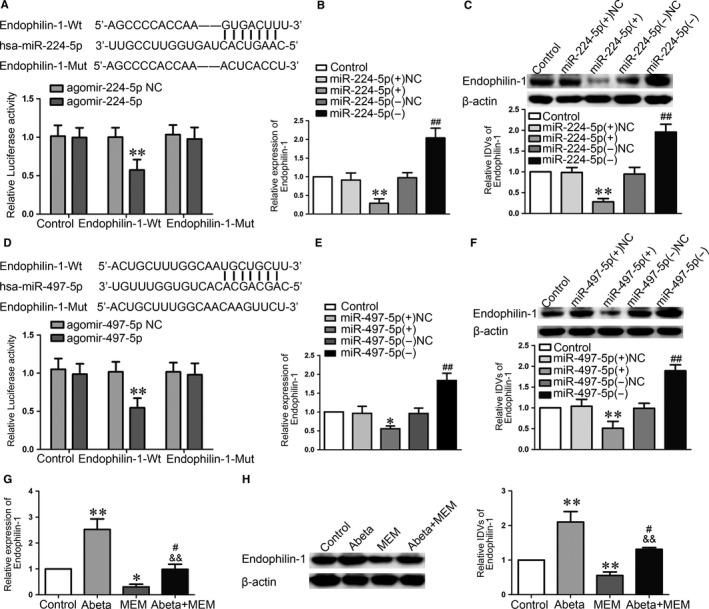
MiR‐224‐5p/miR‐497‐5p targeted Endophilin‐1. (A, D) Dual‐luciferase reported assay was used to perform the relative luciferase activity. Data represent mean ± SD (n = 3, each). **P < 0.01 vs Endopilin‐1‐Wt + agomir‐224‐5p NC/Endopilin‐1‐Wt + agomir‐497‐5p NC group. (B, E) qRT‐PCR was used to detect the relative mRNA expression level of Endophilin‐1 in Abeta1‐42‐incubated ECs. (C, F) Western blot analysis was used to determine the expression of Endophilin‐1 in Abeta1‐42‐incubated ECs. Data represent mean ± SD (n = 3, each). *P < 0.05,**P < 0.01 vs miR‐224‐5p (+) NC/miR‐497‐5p (+) NC group, ## P < 0.01 vs miR‐224‐5p (−) NC/miR‐497‐5p (−) NC group. (G) qRT‐PCR was used to detect the relative mRNA expression level of Endophilin‐1 in ECs with Abeta1‐42, MEM and Abeta1‐42 + MEM by qRT‐PCR. Data represent mean ± SD (n = 3, each). *P < 0.05,**P < 0.01 vs Control group, && P < 0.01 vs Abeta1‐42 group, # P > 0.05 vs Control group. (H) Western blot analysis was used to determine the expression of Endophilin‐1 in ECs pre‐incubated with Abeta1‐42, MEM and Abeta1‐42 + MEM. Data represent mean ± SD (n = 3, each). **P < 0.01 vs Control group, && P < 0.01 vs Abeta1‐42 group, # P > 0.05 vs Control group