-
A
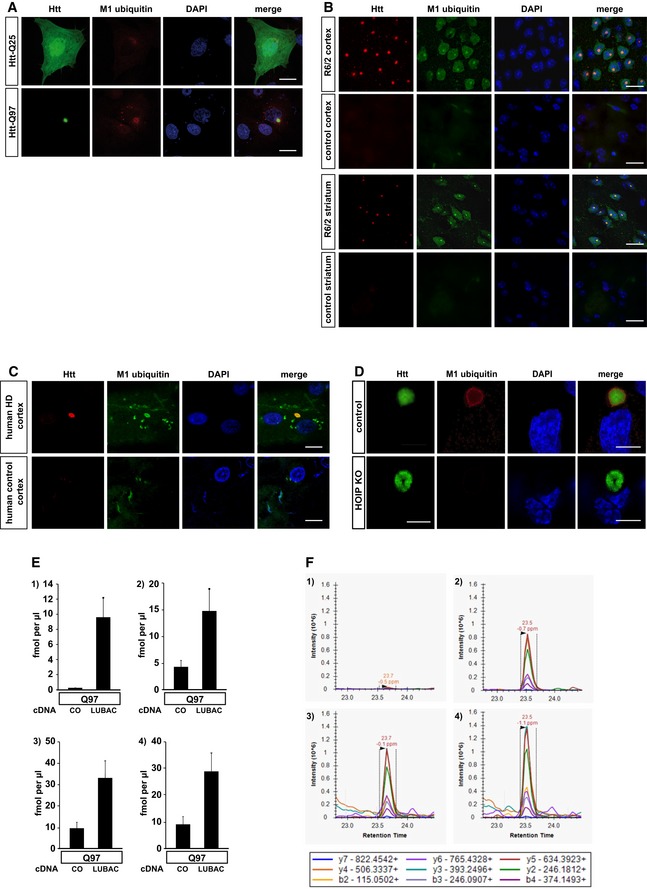
SH‐SY5Y cells expressing Htt‐Q25‐GFP (upper panel) or Htt‐Q97‐GFP (lower panel) were stained for M1 ubiquitin (red) and DAPI (blue). Scale bar, 10 μm.
-
B, C
M1‐linked ubiquitin co‐localizes with Htt‐polyQ aggregates in R6/2 mouse cortex and striatum (B) and human HD frontal cortex (C). Autofluorescent lipofuscin appears in the green channel in human brain. Scale bar, 20 μm (B), 10 μm (C).
-
D
HAP1 WT (control) or HOIP KO HAP1 cells expressing Htt‐Q97‐GPF (green) were stained for M1 ubiquitin (red) and DAPI (blue). Scale bar, 10 μm.
-
E
Quantification of ubiquitin chains associated with SDS‐insoluble Htt‐Q97 from HEK293T cells by mass spectrometry (1: M1, 2: K11, 3: K48, and 4: K63). The standard error is shown with error bars (n = 3).
-
F
Extracted chromatograms from the M1 ubiquitin measurements. Upper panels show the quantification of the ubiquitin chain peptide, while the lower panels show the spiked in reference peptide used for quantification. Panels 1 and 3 show an example of Htt‐Q97, and panels 2 and 4 show an example of Htt‐Q97 + LUBAC. Above each peak, the retention time and mass error are shown. Below the panels a legend identifying the product ions observed and used for quantification is shown.

