-
A
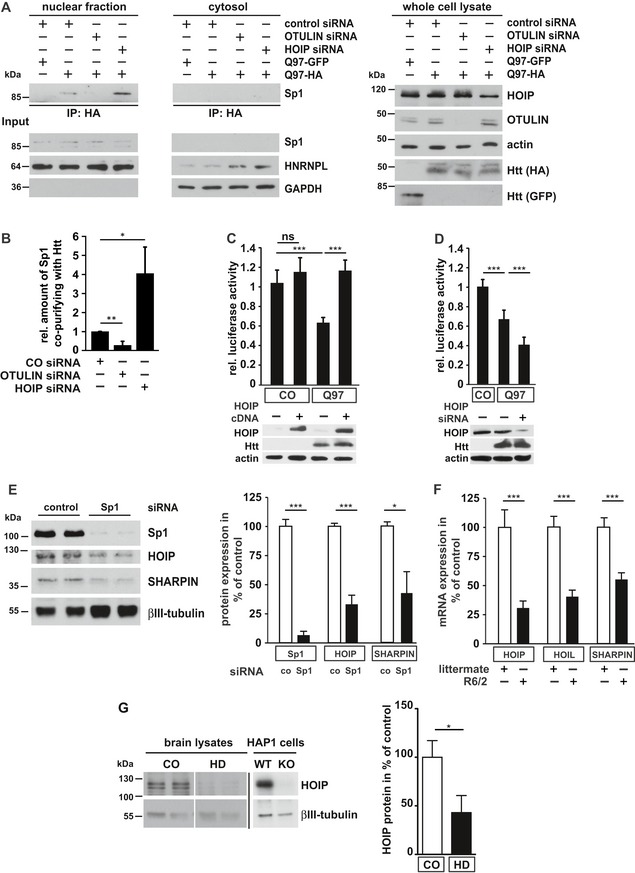
The interaction between Htt‐Q97 and Sp1 is decreased by linear ubiquitination. HEK293T cells were co‐transfected with Htt‐Q97‐HA and the siRNAs indicated. Htt‐Q97‐GFP was transfected as a control for specific immunoprecipitation of HA‐Htt‐Q97. Nuclear (left panel) and cytosolic fractions (middle panel) were subjected to an anti‐HA immunoprecipitation followed by Western blotting using an anti‐Sp1 antibody. Right panel: input controls (whole cell lysates).
-
B
Quantification of the interaction between Htt‐Q97 and Sp1 in nuclear fractions. Shown is the relative amount of Sp1 co‐purifying with Htt‐Q97. Signal intensities were normalized to nuclear Sp1. Data are displayed as mean ± SD and were analyzed by two independent Mann–Whitney U‐tests, n = 4.
-
C, D
Impairment of Sp1‐mediated transcription by Htt‐Q97 is modified by HOIP. (C) Shown is the relative luciferase activity in HEK293T cells expressing Htt‐Q97‐HA, a Sp1 luciferase reporter construct, and HOIP cDNA. Data are displayed as mean ± SD and were analyzed by Kruskal–Wallis test followed by Dunn's multiple comparison test, n = 9–11. (D) Shown is the relative luciferase activity in HEK293T cells expressing Htt‐Q97‐HA, a Sp1 luciferase reporter construct, and HOIP siRNA. Data are displayed as mean ± SD and were analyzed by one‐way ANOVA followed by Tukey's multiple comparison test, n = 9.
-
E
Sp1 silencing decreases HOIP and SHARPIN protein expression. SH‐SY5Y cells were transfected with control or Sp1‐specific siRNAs and analyzed for protein expression 2 days after transfection by immunoblotting (left panel). Quantification of normalized Sp1, HOIP, and SHARPIN protein expression levels (right panel). Data are displayed as mean ± SEM with n = 5 from unpaired two‐tailed Student's t‐tests.
-
F
HOIP‐, HOIL‐1L‐, and SHARPIN‐specific mRNAs are decreased in R6/2 striatum. Quantification of mRNA from the striatum of 9‐ to 12‐week‐old R6/2 mice and non‐transgenic littermates. Data are displayed as mean ± SD with n = 6–9 biological replicates from unpaired two‐tailed Student's t‐tests.
-
G
HOIP protein levels are decreased in human HD brain. Total protein lysates from human brain (anterior cingulate cortex) were analyzed by immunoblotting using antibodies against HOIP and βIII‐tubulin. HOIP‐positive signals were normalized to βIII‐tubulin. To verify the specificity of the HOIP antibody, WT and HOIP KO HAP1 cells were analyzed in parallel on a different gel. Data are displayed as mean ± SEM with n = 5 for control and n = 7 for HD patients from unpaired two‐tailed Student's t‐tests.
. *
0.001.

