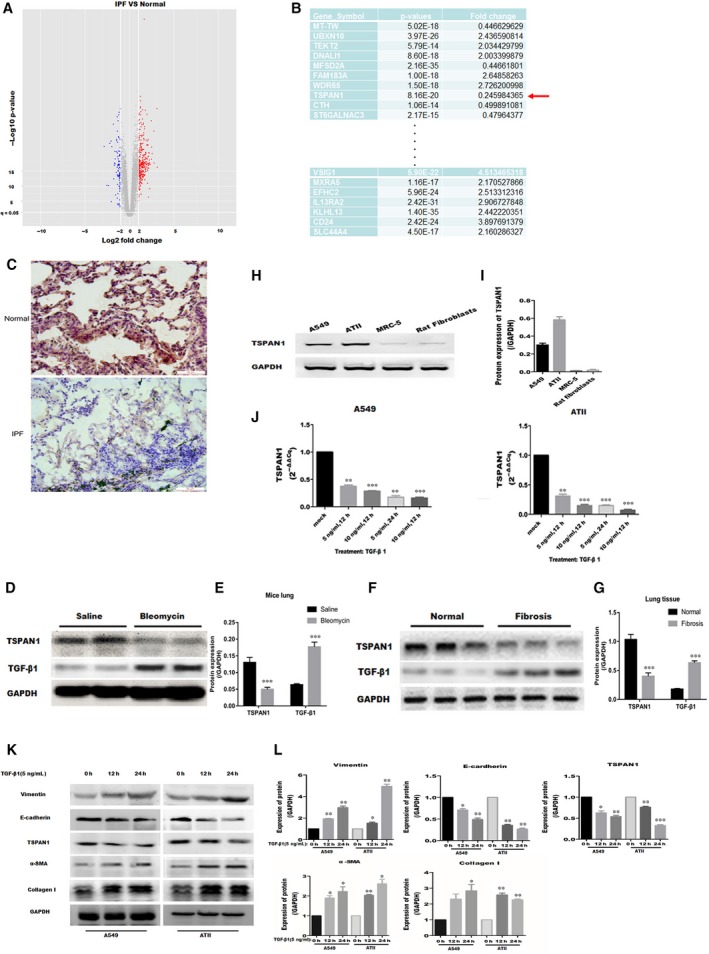
Figure 1.

Screening of gene in idiopathic pulmonary fibrosis (IPF) and identification of tetraspanin 1 (TSPAN1) in vivo and vitro. A, Volcano plot shows that the two vertical lines are the two‐fold change boundaries and the horizontal line is the statistical significance boundary (P < 0.05). Genes with fold change ≥2 and statistical significance are marked with red dots, genes with fold change ≤0.5 and statistical significance are marked with blue dots. B, tetraspanin 1 as a candidate gene was low expressed in the IPF and the fold change was marked by red arrow. C, The protein expression of TSPAN1 in IPF and normal lung tissue was detected by immunohistochemical staining. Magnification: 200X. D, All specimens were observed from mice at day 21 after bleomycin treatment, and the protein expression of TSPAN1 and transforming growth factor‐β1 (TGF‐β1) was verified by Western blotting in the mouse model of bleomycin‐induced pulmonary fibrosis. E, Quantification results in panel D. The data are expressed as the means ± SEM (n = 3). Representative data from 1 of three independent experiments are shown (***P < 0.001 vs Saline). F, Lung tissue of IPF or normal tissues were obtained after surgery. Protein expression of TSPAN1 and TGF‐β1 was detected by Western blotting in Lung tissue of IPF or normal tissue. G, Quantification of the results in panel F. The data are expressed as the means ± SEM (n = 3) (*P < 0.05 vs normal). H, Western blotting was used to detect the protein expression of TSPAN1 in A549, alveolar epithelial type II (ATII) cells, MRC‐5 and rat fibroblasts. I, Quantification of the results in panel H. The data are expressed as the means ± SEM (n = 3), with results representative of three independent experiments. J, A549 and ATII cells were treated with TGF‐β1 (5 or 10 ng/mL) for 12 or 24 h and then the mRNA expression of TSPAN1 was detected by quantitative real‐time PCR in the cells, data are expressed as the means ± SEM (n = 3), with results representative of three independent experiments. (*P < 0.05, **P < 0.01 and ***P < 0.001 vs mock). K, A549 and ATII cells were treated with TGF‐β1 (5 ng/mL) for 12 or 24 h and the protein expression of TSPAN1 and epithelial‐to‐mesenchymal transition‐related marker were detected by Western blotting in the cells. L, Quantification of the results in panel (K). The data are expressed as the means ± SEM (n = 3), with results representative of three independent experiments. (*P < 0.05, **P < 0.01 and ***P < 0.001 vs 0 h)
