Figure 2.

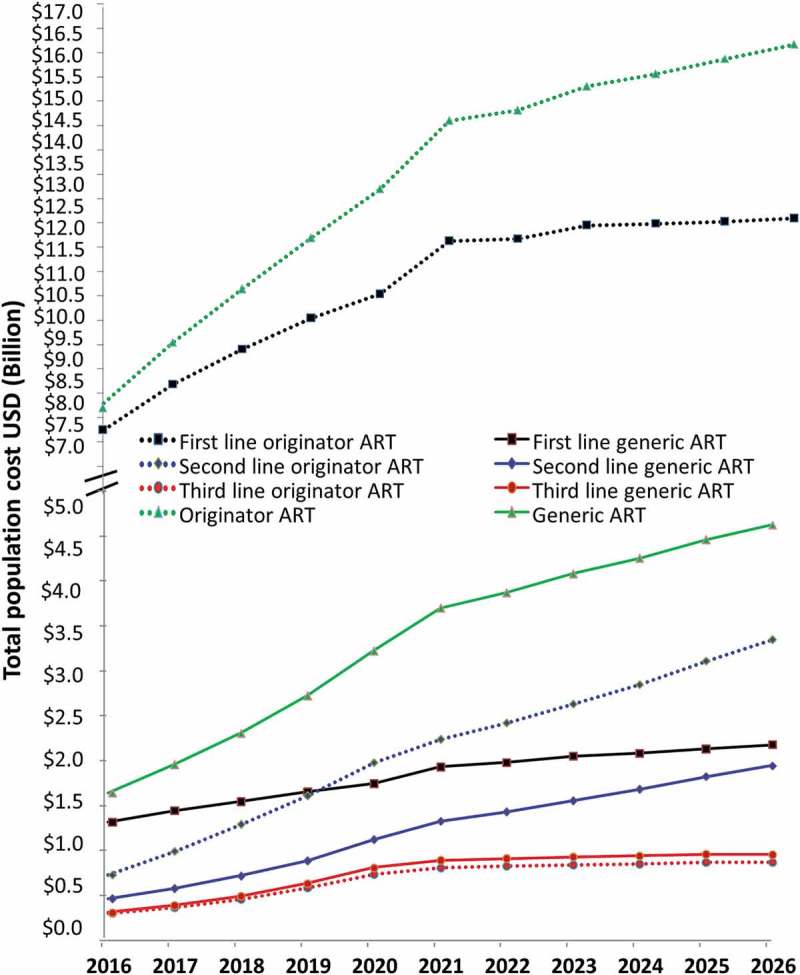
Projections 2016–2026 of originator and generic prices comparing population costs in US dollars (US$) for people on first-, second-, and third-line antiretroviral therapy (ART) and across all lines of therapy (broken axis).

Projections 2016–2026 of originator and generic prices comparing population costs in US dollars (US$) for people on first-, second-, and third-line antiretroviral therapy (ART) and across all lines of therapy (broken axis).