
Supplementary Figure 2.
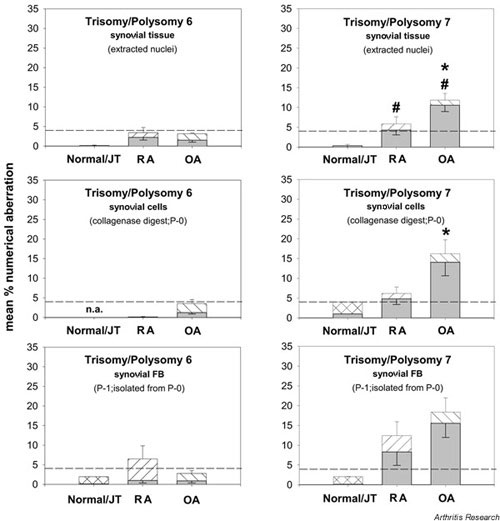
Comparison of numerical chromosomal aberrationsin the RA, OA, and normal/JT synovial membrane. Polysomy (hatched bars) and trisomy (shaded bars) of the individual chromosomes in extracted nuclei from synovial tissue, nonseparated synovial cells (collagenase digest), and isolated synovial fibroblasts (FB; P-1) are depicted as means ± SEM of n = 5–18 patients. #P ≤ 0.05 versus normal/JT for the comparison of polysomies; *P ≤ 0.05 versus RA for the comparison of polysomies. While chromosome 6 showed almost no numerical aberrations (with the exception of an increased level of polysomy 6 in P-1 RA synovial FB), both OA and RA synovial tissue showed a significant elevation of polysomy 7 in comparison with normal/JT tissue, with a significantly higher value in OA than in RA. A significant difference between RA and OA was also observed in nonseparated synovial cells (P-0).