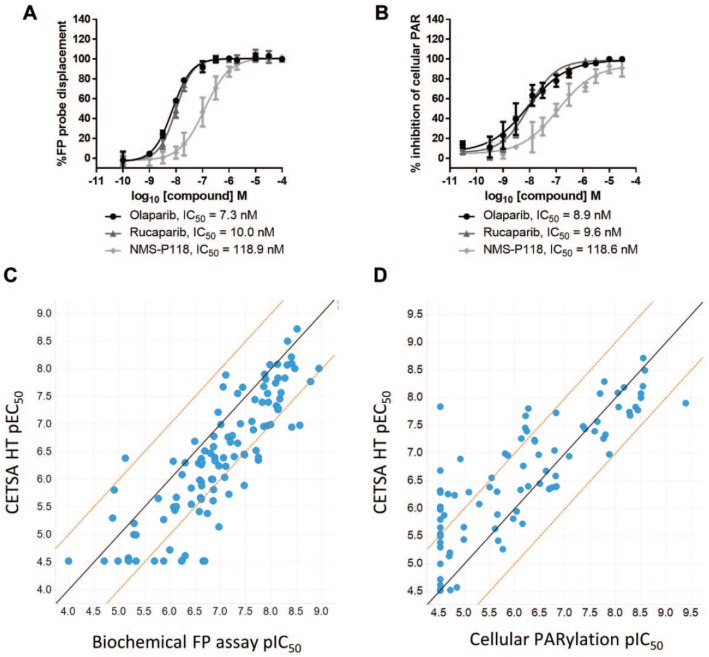
Figure 3.
Comparison of PARP inhibitor potency in CETSA HT with alternative assay formats. (A) A biochemical FP assay was employed to measure binding to purified PARP1 protein via competition of an FP probe. Data for PARP inhibitors, comparable to CETSA data in Figure 2B, are shown. Data are the mean ± standard deviation of ⩾4 technical replicates. (B) A cellular PARylation assay was employed to measure cellular PARP function. A549 cells were treated with PARP inhibitors for 1 h before addition of a DNA-damaging agent and imaging and quantifying PARylation. Data are the mean ± standard deviation of four technical replicates. (C) pEC50 determined by ITDRFCETSA plotted against pIC50 determined in the biochemical FP assay for 112 PARP inhibitors. The solid line shows a 1:1 correlation, and dashed lines represent a 1 log10 shift in potency. (D) pEC50 determined by ITDRFCETSA plotted against pIC50 determined in the cellular PARylation assay for 99 of the same PARP inhibitors. The solid line shows a 1:1 correlation, and dashed lines represent a 1 log10 shift in potency.

