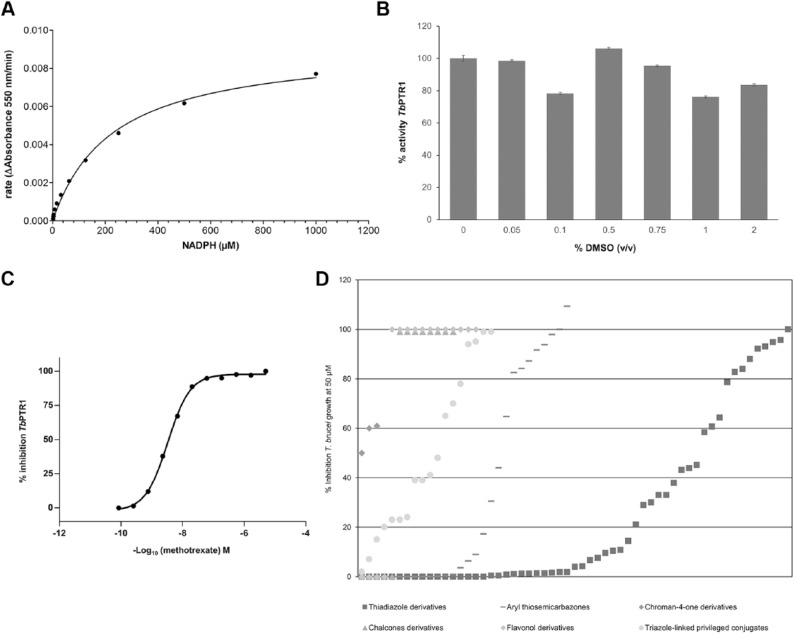
Figure 2.
(A) Determination of the Km for the NADPH for TbPTR1 enzyme (Km 229.1 ± 25.4 µM). The duplicate data from these experiments were fitted using the four-parameter logistic equation using GraphPad Prism (version 5.02, GraphPad Software, Inc.), and standard deviations are within ±10% of the values of the rates. (B) DMSO tolerance. (C) Compound concentration-response curve for TbPTR1 target-based assay against methotrexate (IC50 2.62 ± 0.12 nM; Hill slope 0.72 ± 0.04), and standard deviations are within ±10% of the values. (D) Summary of compounds evaluated (see Table 1 for details) were shown to inhibit T. brucei growth at 50 µM. See the Materials and Methods section for full experimental details.

