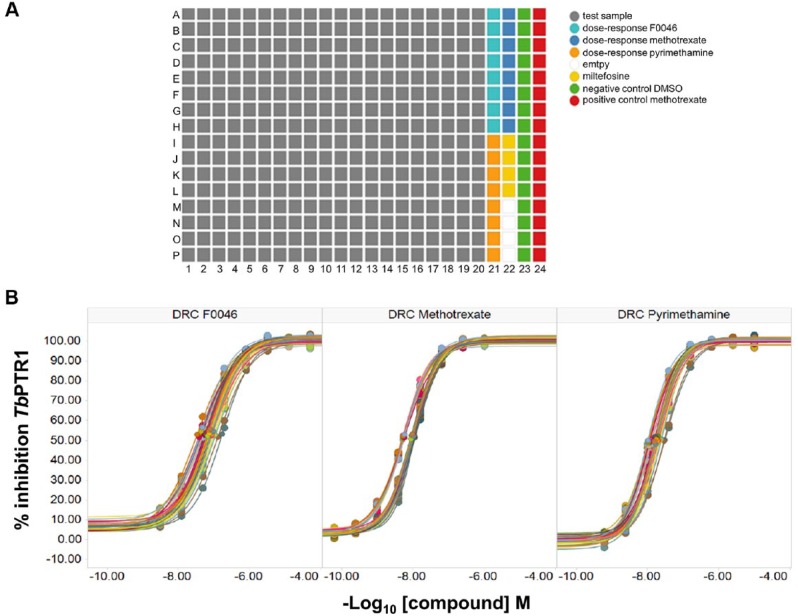
Figure 3.
(A) Layout of samples and controls in assay plates for the TbPTR1 target-based screen against the MycoDiverse natural products library. (B) Dose-response curves (DRC) and average IC50 values across all 34 assay plates for each reference compound were for methotrexate 8.6 ± 2.3 nM, F0046 73 ± 27 nM, and pyrimethamine 16.7 ± 5.0 nM. Standard deviations are within ±10% of the values.

