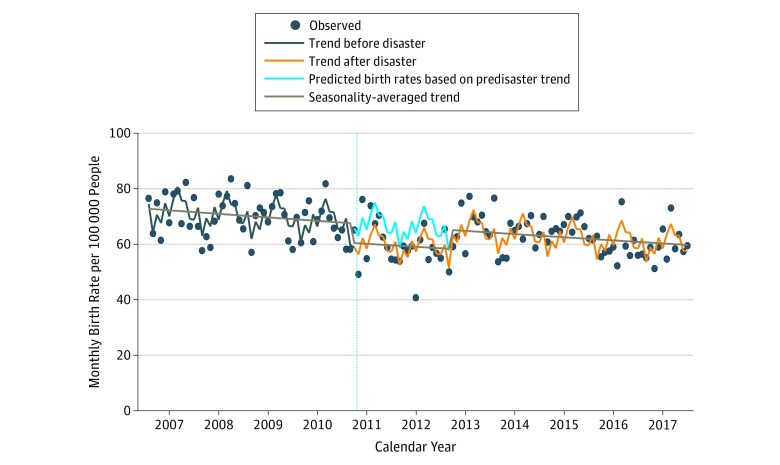
Figure. Trend in Birth Rates Estimated From Interrupted Time Series Analysis.
The trend in birth rates was estimated using the Poisson regression model, including the temporal level change (gap) and the indicator variable of the calendar month. The rate ratio during the 2 years after the Fukushima Daiichi Nuclear Power Plant disaster was 0.90 (95% CI, 0.86-0.93). The dots indicate observed birth rates. The vertical line indicates the time of the Fukushima Daiichi Nuclear Power Plant disaster between February and March 2011.

