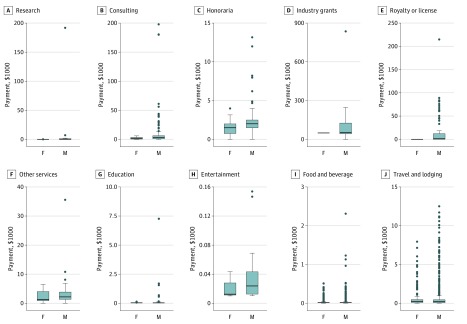
Figure. Distribution of 2016 Industry Payments by Payment Type and Physician Sex.
Bolded line represents median. Box ends represent first and third quartiles. Whisker ends represent minimum and maximum values. Individual points represent outliers. F indicates female radiation oncologists; M, male radiation oncologists.

