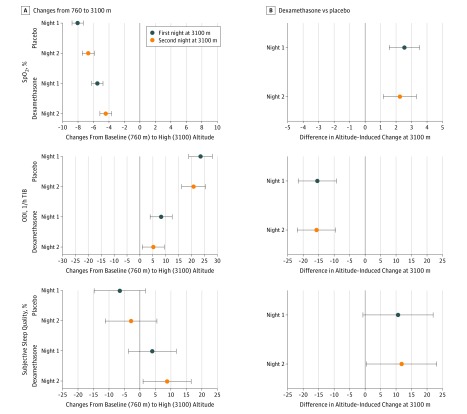
Figure 2. Effect of Altitude and Dexamethasone on Clinical and Physiologic Outcomes.
A, Mean differences in altitude-induced changes in the first and second nights at 3100 m compared with the corresponding baseline examination at 760 m in patients receiving dexamethasone and placebo. For the top graph, negative changes favor 760 m. For the middle graph, positive changes favor 760 m. For the bottom graph, negative changes favor 760 m. B, Mean differences in altitude-induced changes measured at 3100 m between patients receiving dexamethasone and placebo (treatment effect of dexamethasone). For the top graph, positive changes favor dexamethasone. For the middle graph, negative changes favor dexamethasone. For the bottom graph, positive changes favor dexamethasone. Subjective sleep quality was assessed by a visual analog scale (range, 0 [extremely bad] to 100 [excellent]). Error bars indicate 95% CI. ODI indicates oxygen desaturation index >3% dips in arterial oxygen saturation; Spo2, mean nocturnal oxygen saturation assessed by pulse oximetry; and TIB, time in bed.

