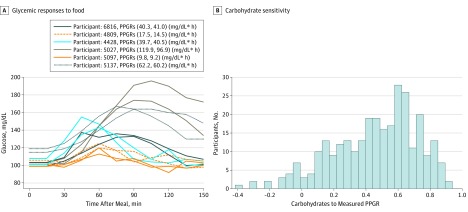
Figure 2. Variability in Glycemic Responses to Food Among the Individuals in the Cohort.
A, Shown is an example of intraindividual consistency and interindividual variability in response to the bagel and cream cheese meal. The key shows the participant number and the computed postprandial glycemic response (PPGR) for meals eaten by the same participant on different days. Postprandial glycemic response was computed as the incremental area under the curve of blood glucose levels in the 2 hours after a meal (to convert glucose to mmol/L, multiply by 0.0555). B, Carbohydrate sensitivity is measured as the correlation between carbohydrates (in grams) in the meal consumed and the PPGR.

