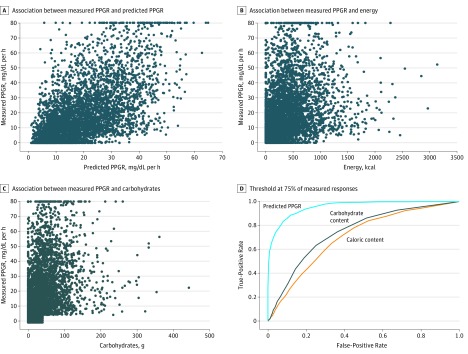
Figure 4. Performance of the Model Developed in This Study, as Well as Calorie-Only or Carbohydrate-Only Models, in Predicting the Postprandial Glycemic Response (PPGR) to Food.
A-C, Correlation between measured and various PPGR predictors. For definition of the measured PPGRs, see the Outcomes subsection in the Methods section. C, Note that rare cases in which meals were reported to have more than 40 g of carbohydrates showed a remarkably low glycemic response (<5 mg/dL*h), and were excluded to reduce potential influences of meal misreporting. D, Receiver operating characteristic curve analysis for comparison of the model presented herein, as well as models based on the calorie or carbohydrate content alone for classifying high PPGR, where high PPGR was defined as the 75th percentile of all measured PPGRs in the US cohort. Additional receiver operating characteristic curve analyses at other PPGR quantiles are available in the eFigure in the Supplement.

