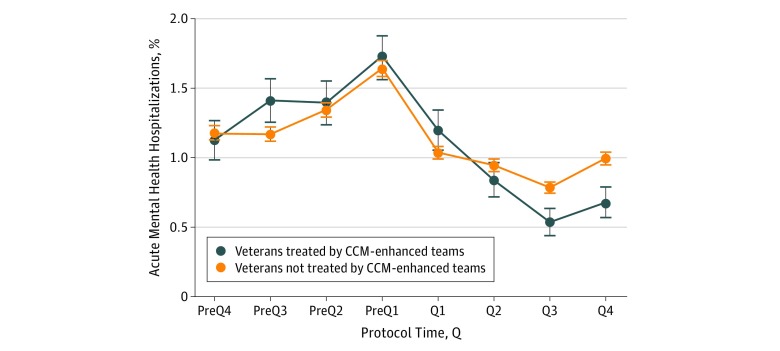
Figure 3. Mental Health Hospitalization Rates.
The x-axis displays protocol time, with implementation support occurring from Q1 through Q4. The blue line represents hospitalization rate for veterans treated by collaborative chronic care model (CCM)–enhanced teams, and the orange line represents veterans from the same clinics who were not treated by the CCM-enhanced teams (see text for details). Error bars represent SEs. Q indicates quarter of the year.

