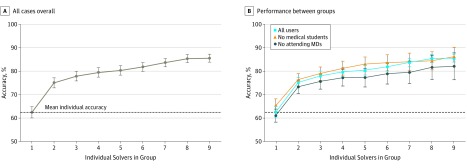
Figure 1. Diagnostic Accuracy for the Base Case Rule by Group Size Overall and by User Training.
Each point shows the accuracy of groups using the base case rule of using all diagnoses from each to make a collective differential diagnosis list and assessing the top 3 weighted diagnoses in the collective for diagnostic success. A, Curve for all cases overall. B, Comparison of performance between groups with and without medical students or attending physicians. To create the collective differential diagnosis list, individuals’ diagnoses were weighted inversely to their position on a differential list (eg, the first diagnosis has a weight of 1, the second is 1/2, and so on). For each group, we summed diagnosis weights to produce a ranked list and used the top 3 diagnoses in this collective differential to assess accuracy. The y-axis represents accuracy, the percentage of cases with the correct diagnosis in the top 3 collective diagnoses listed, for increasing group sizes of randomly chosen users. The dashed line indicates the average accuracy for individual solvers across the 1572-case sample. Error bars indicate 95% CIs.

