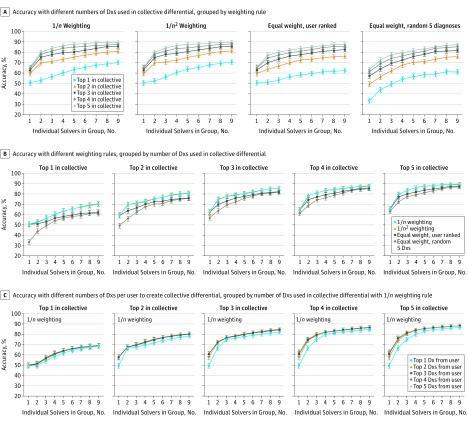
Figure 2. Range of Diagnostic Accuracy of Collective Differential Diagnoses (Dxs) Across Different Specifications.
Each panel shows the accuracy of groups using multiple variations on the rules for making a collective differential and adjudicating a solution. The base case used in the other figures corresponds to 1/n weighting with 3 Dxs used in the collective differential. In all panels, the y-axis represents accuracy, the percentage of 1572 cases with the correct Dx in the collective differential, for increasing group sizes of randomly chosen physician users. Error bars indicate 95% CIs. A, A different weighting scheme was applied to the nth Dx for each user in the group: 1/n, 1/n2, equal weight to all Dxs, and equal weight for 5 randomly ordered Dxs per user. A separate colored curve is shown for the change in accuracy using the top 1 through 5 Dxs in the collective differential to adjudicate a solution. B, The same results as in part A, but each panel instead shows 4 separate colored curves for each weighting scheme using the top 1 through 5 Dxs in the collective differential to adjudicate a solution. C, The 1/n weighting rule, with each panel showing 5 separate curves for using the top 1 through 5 Dxs from each user’s solution to create the collective differential.

