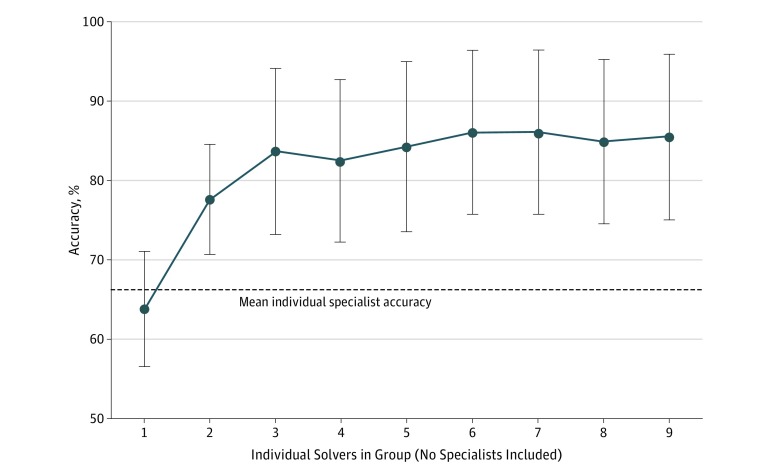
Figure 4. Diagnostic Accuracy for Nonspecialist Groups Compared With Individual Specialists.
Shown is the accuracy, the percentage of cases with the correct diagnosis in the top 3 diagnoses listed, for increasing group sizes of randomly chosen nonspecialist physician users. Each group is composed of a set of users whose specialty does not match the specialty of the individual case. The dashed line indicates the individual accuracy of specialist physicians whose specialty matches the case (eg, cardiology for a cardiovascular presenting symptom). Error bars indicate 95% CIs.

