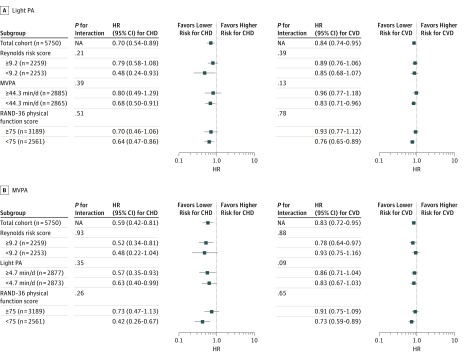
Figure 2. Associations of Physical Activity (PA) With Coronary Heart Disease (CHD) and Cardiovascular Disease (CVD) Events, by Selected Participant Characteristics.
A, Associations comparing the 75th vs 25th percentiles of light PA (difference of 1.6 hours per day) with incident CHD and CVD events. B, Associations comparing the 75th vs 25th quartiles of moderate to vigorous PA (MVPA) (difference of 42 minutes per day) with incident CHD and CVD events. Hazard ratios (HR) were adjusted for age, race/ethnicity, highest education, current smoking, alcohol consumption, physical functioning, comorbidity, and self-rated health (where appropriate). Reynolds Risk Score, MVPA, physical functioning, and light PA were split at the median. Hazard ratios below 1 indicate favorable associations (ie, lower risk), whereas those above 1 indicate harmful associations (ie, higher risk). NA indicates not applicable; error bars, 95% CIs. The n values for subanalyses stratified by Reynolds Risk Score do not sum to 5750 because of missing biomarker data.

