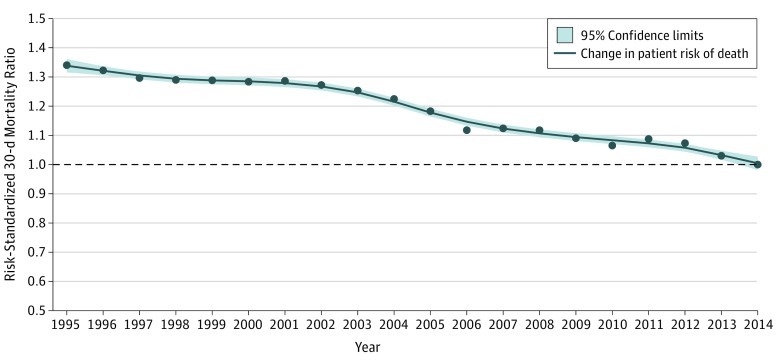
Figure 1. Change in Adjusted Risk of 30-Day Acute Myocardial Infarction Mortality at the Patient Level Between 1995 and 2014.
Points indicate year-specific risk-standardized 30-day mortality ratios. The line was smoothed using the locally estimated scatterplot smoothing (LOESS) method (local regression).

