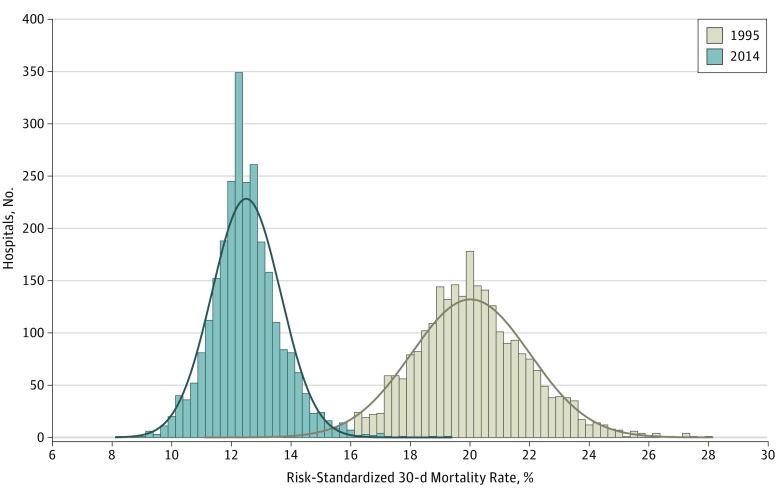
Figure 2. Change in Hospital-Specific Risk-Standardized 30-Day Acute Myocardial Infarction Mortality Rates Between 1995 and 2014.
The size of each bar reflects the number of hospitals that filled in a particular interval of risk-standardized mortality rate as well as the distributions (ranges) of rates in 1995 and 2014. The curves represent distribution of the data. Mean (SD) risk-standardized 30-day mortality rates were 20.0% (2.0%) and 12.5% (1.2%) for 1995 and 2014, respectively (n = 2635 hospitals). Restricted to hospitals that had at least 1 case in both 1995 and 2014.

