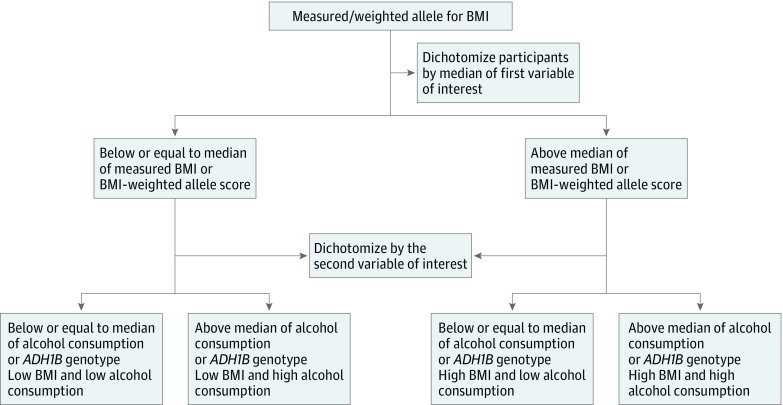
Figure 1. Flow Diagram for the Generation of Factorial Groups, Using Observational and Genetic Data.
Factorial multivariable: both body mass index (BMI) and weekly alcohol consumption were dichotomized based on the median of measured or self-reported values. Values equal to or below the median were categorized as the low group, and those above the median were categorized as the high group. Factorial mendelian randomization (MR): For genetic propensity, BMI was categorized according to the median of the weighted allele score for BMI, with values equal to or below the median categorized as low BMI and those above the median categorized as high BMI. Alcohol propensity was determined according to ADH1B alleles. Individuals who were homozygous for the alcohol-decreasing traits and heterozygous individuals were combined, as determined to be appropriate based on previous MR analyses of these traits on alcohol intake,11 to create the low alcohol-propensity group. The high alcohol-propensity group contains all individuals homozygous for the alcohol-increasing trait. Adapted from Ference et al.12

