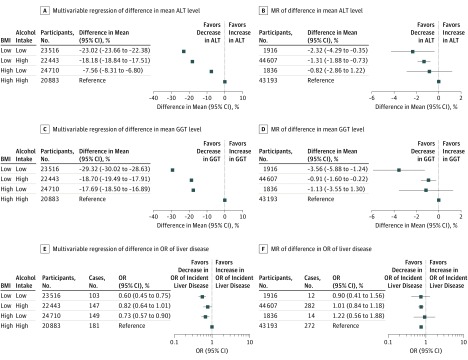
Figure 4. Multivariable and Mendelian Randomization (MR) Factorial Analyses Assessing the Joint Associations of Body Mass Index (BMI) and Alcohol With Biomarkers of Liver Injury and Incident Liver Disease.
A, Multivariable regression of percentage difference in mean alanine aminotransferase (ALT) level by joint observational BMI and alcohol categories. B, MR of percentage difference in mean ALT level by joint genetic BMI and alcohol categories. C, Multivariable regression of percentage difference in mean γ-glutamyltransferase (GGT) level by joint observational BMI and alcohol categories. D, MR of percentage difference in mean GGT level by joint genetic BMI and alcohol categories. E, Multivariable regression of odds ratio (OR) of liver disease by joint observational BMI and alcohol categories. F, MR of OR of liver disease by joint genetic BMI and alcohol categories. Low vs high BMI (calculated as weight in kilograms divided by height in meters squared), 1.49-SD difference in multivariable analyses and 0.51 SD in MR analyses. Low vs high alcohol, 14.68 U/wk difference in multivariable analyses and 1.78 U/wk difference in MR analyses, where 1 U of alcohol is equivalent to 12 g. Multivariable analysis was adjusted for age, sex, smoking, educational level, income, and physical activity.

