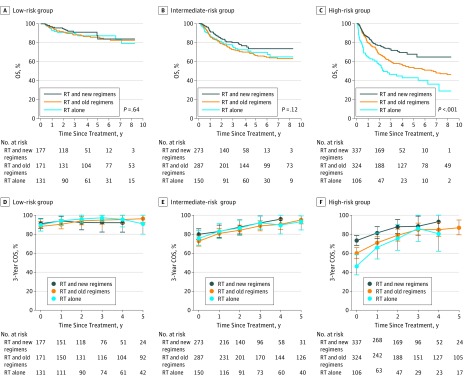
Figure 4. Kaplan-Meier Survival Curves and Conditional Survival Stratified by Treatment in Each Risk Group.
A-C, Kaplan-Meier curves of overall survival (OS) for radiotherapy (RT) and non–anthracycline-based (new) regimens, RT and anthracycline-based (old) regimens, and RT alone in low-risk (A), intermediate-risk (B), and high-risk (C) patients. D-F, The 3-year conditional overall survival (COS) for RT and new regimens, RT and old regimens, and RT alone in low-risk (D), intermediate-risk (E), and high-risk (F) patients. Lines connecting the conditional survival for each time are linear connectors between estimates. Error bars denote 95% CIs.

