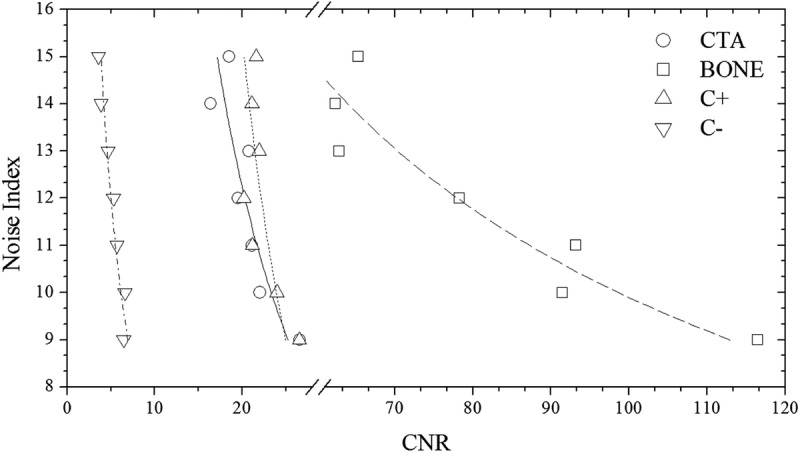
FIGURE 6.

Protocol C: Graph shows user selected NI versus CNRI for CTA, CNRB for BONE, CNRI for C+, and CNRST for C− clinical mode in thorax ATVS-activated acquisitions of the 5-year-old phantom. Association between NI and CNR was determined using polynomial fitting as NI = aK × CNR−bK. αK/bK, R2 fitting parameters for all phantoms, and anatomical regions are tabulated in Table S3, Supplemental Digital Content, http://links.lww.com/RLI/A419.
