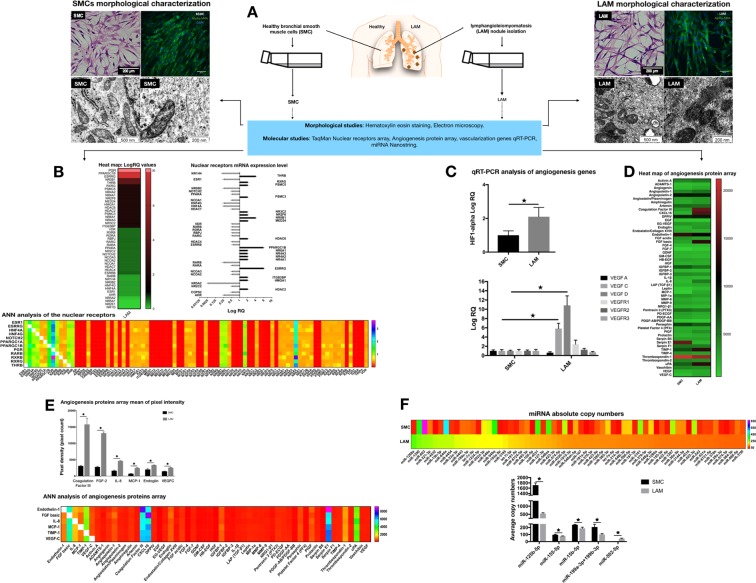
Fig. 1.
Morphological and molecular characterization of bronchial SMC controls and LAM cell lines. a Study rationale and cellular morphology. Normal bronchial SMC controls (n = 2) and patient-derived LAM cell lines (n = 4) were stained for hematoxylin eosin (magnification ×10, size-bar 200 μm) and for alpha-smooth muscle actin (ASMA) (ASMA green, DAPI blue, magnification ×40, size bar 40 μm). Electron microscopy of mitochondria in LAM cells and normal bronchial SMC controls (magnification 200 nm, the scale bar 500 nm). b Nuclear receptor TaqMan arrays n = 2 (data were generated from pooled samples of normal bronchial SMC controls n = 2, or patient derived LAM cell lines n = 4, respectively). Heat map of LogRQ values are shown. Nuclear receptor TaqMan data presented as LogRQ ± technical error of the replicates. ANN analysis of the nuclear receptor arrays was performed to demonstrate hidden interactions among different nuclear receptors. c Deregulation of VEGF expression in LAM samples. qRT-PCR analysis of genes affecting angiogenesis were performed and beta-actin was used as inner control. Data are presented as mean of log RQ ± SEM. Significant changes are marked as asterisk (P < 0.05); d Heat map of angiogenesis protein array. The figure presents mean of pixel intensity. e Angiogenesis array results of LAM cell lines n = 3 and normal SMC control n = 2 presented as mean of pixel intensity ± SEM. Significant changes are marked as asterisk (P < 0.05). ANN analysis of angiogenesis protein interaction hierarchy. f Analysis of 798 miRNA absolute copy numbers by Nanostring. miRNA copy numbers detected by Nanostring in pooled LAM (n = 4) and pooled, normal SMC (n = 2) samples. The heat map represents the most deregulated 141 miRNA in LAM samples compared to normal SMC controls. Copy number differences of specific miRNAs that are involved in mitochondrial biogenesis detected after Nsolver analysis were further analyzed in individual cell lines (normal SMCs (n = 2) and LAM (n = 4)). Data are presented as average copy number ± SEM, significant changes are marked as asterisk (P < 0.05)

