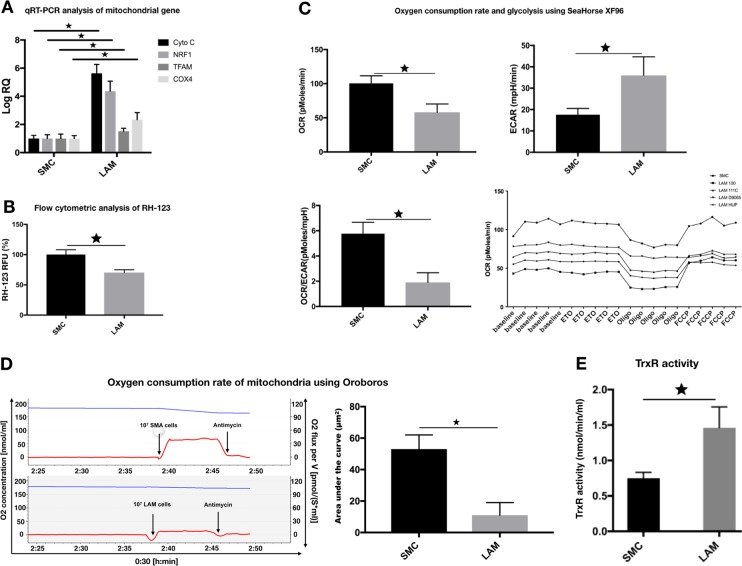
Fig. 2.
Altered function of mitochondria in LAM cells. a qRT-PCR analysis of mitochondrial gene expression in individual LAM cell lines (n = 4) compared to normal SMC controls (n = 2). Data are presented as mean log RQ ± SEM and significant changes are marked as asterisk (P < 0.05). b Flow cytometric analysis of RH-123 fluorescence intensity in individual LAM cell lines (n = 4) compared to normal SMC controls (n = 2). Data are presented as mean RFU ± SEM; significant changes are marked as asterisk (P < 0.05). c Oxygen consumption rate and glycolysis were measured by SeaHorse XF96 in individual LAM (n = 4) cell lines and normal SMC control cells (n = 2). Representative OCR and ECAR data are presented as mean ± SEM, significant changes are marked as asterisk (* P < 0.05). d Measurements of mitochondrial activity. Oxygen consumption rate of mitochondria measured using Oroboros (blue line = oxygen concentration, red line = oxygen flux per volume; quantification of oxygen consumption (area under the curve). e TrxR activity measured in individual LAM (n = 4) and normal, bronchial SMC control (n = 2) samples. Data are TrxR; activity is presented as mean of nmol min/ml ± SEM; significant changes are marked as asterisk (P < 0.05)

