Fig. 3.
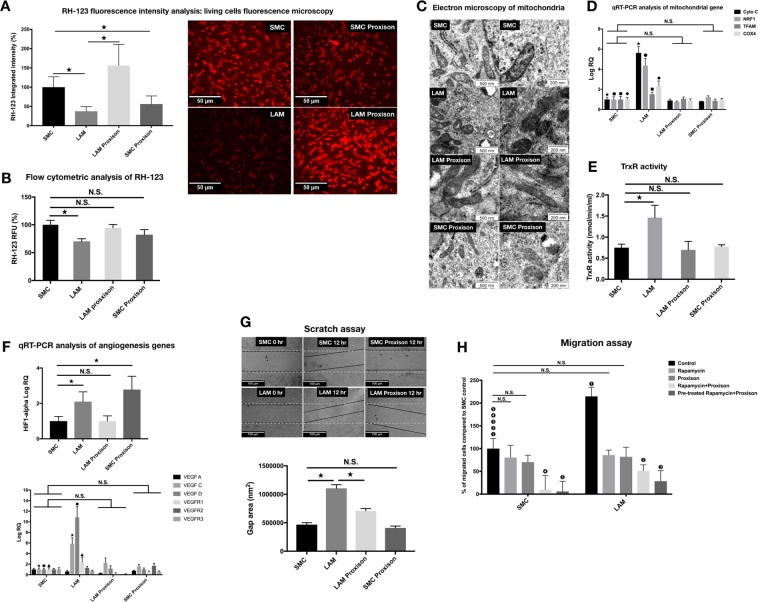
Proxison normalizes mitochondrial morphology and function in LAM cells. a Proxison (3 µM, 1 h)-treated normal SMC and LAM cells were incubated with 2.5 µM RH-123 and then fluorescence microscopy was used to analyze fluorescence intensity (magnification ×20, scale bar 50 µm). Quantification of fluorescence intensity in living cells was performed using ImageJ software. Data are presented as pixel intensity ± SEM; significant changes are marked as asterisk (P < 0.05). b Proxison (3 µM, 1 h)-treated normal SMC and LAM cells were incubated with 2.5 µM RH-123 and then fluorescence was analyzed by flow cytometry. Data are presented as mean of RFU ± SEM; significant changes marked as * P < 0.05. c Representative morphological changes in the mitochondria of LAM cell lines following Proxison treatment. Electron microscopy of mitochondria of untreated and Proxison (3 µM, 1 h)-treated LAM cells and normal SMC control cells (scale bars are 500 and 200 nm, respectively). d qRT-PCR analysis of mitochondrial gene expression in untreated and Proxison (3 µM, 1 h) treated LAM cell lines (n = 4) compared to normal SMC controls (n = 2); Data are presented as mean log RQ ± SEM and significant changes are marked as asterisk, solid circle, solid rhombus, and solid square (P < 0.05). e TrxR activity of Proxison (3 µM, 1h)-treated LAM cell lines (n = 4) compared to normal SMC controls (n = 2). TrxR activity is presented as mean ± SEM and significant changes are marked as asterisk (P < 0.05). f qRT-PCR analysis of angiogenesis related gene expression in untreated and Proxison (3 µM, 1 h)-treated cell cultures (LAM n = 4, normal bronchial SMC n = 2). Data are presented as mean RQ ± SEM and significant changes are marked as asterisk, solid circle, and solid triangle (in all results significance was P < 0.05). g Proliferation capacity following Proxison treatment (n = 3 technical repeats). Representative pictures of scratch assays in untreated and Proxison (3 µM, 1 h)-treated LAM cell lines (n = 4) compared to normal SMC controls (n = 2) after 12 h incubation. Data are presented as mean of cell growth (gap) area nm2 ± SEM; significant changes are marked as asterisk (P < 0.05). h Migration capacity of LAM cell lines. LAM cell lines (n = 2) and normal SMCs (n = 2) were treated with Rapamycin (20 nM, 24 h), Proxison (3 µM, 24 h), Rapamycin (20 nM, 24 h)+Proxison(3 µM, 24 h), and finally cells were pre-treated with Rapamycin for 48 h (20 nM/24 h) and then incubated with Proxison (3 µM, 24 h). Images are presented as the number of cells migrated through the membrane to the lower side of the chamber and were stained with DAPI. Data are presented as the percentage of migrated LAM cells compared to normal SMC ± SEM and significant changes are marked as (1), (2), (3), (4) and (5) (in all results significance was P < 0.05)

