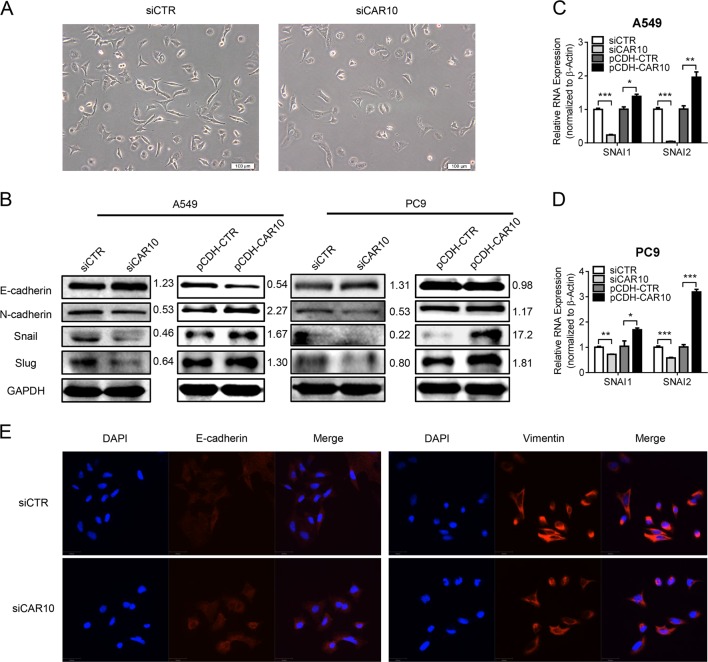
Fig. 4.
CAR10 induced cell EMT via upregulating SNAI1 and SNAI2. a Cell morphology observed by phase-contrast microscopy after A549 cells were transfected with CAR10 Smart Silencer. b Western blot analysis of the EMT markers (E-cadherin and N-cadherin) and Snail and Slug expression in A549 and PC9 cells with silencing or overexpressing CAR10. c, d Quantitative RT-PCR mRNA expression analysis of SNAI1 and SNAI2 in A549 and PC9 cells transiently silencing or stably overexpressing CAR10. Data are shown as mean ± SEM; n = 3 independent experiments, two-tailed Student’s t test. e Confocal microscopy images of immunostaining for E-cadherin and vimentin and merged with DAPI in A549 cells with silenced CAR10. Scale bar: 50 μm. *P < 0.05, **P < 0.01, and ***P < 0.001. NS no statistical significance

