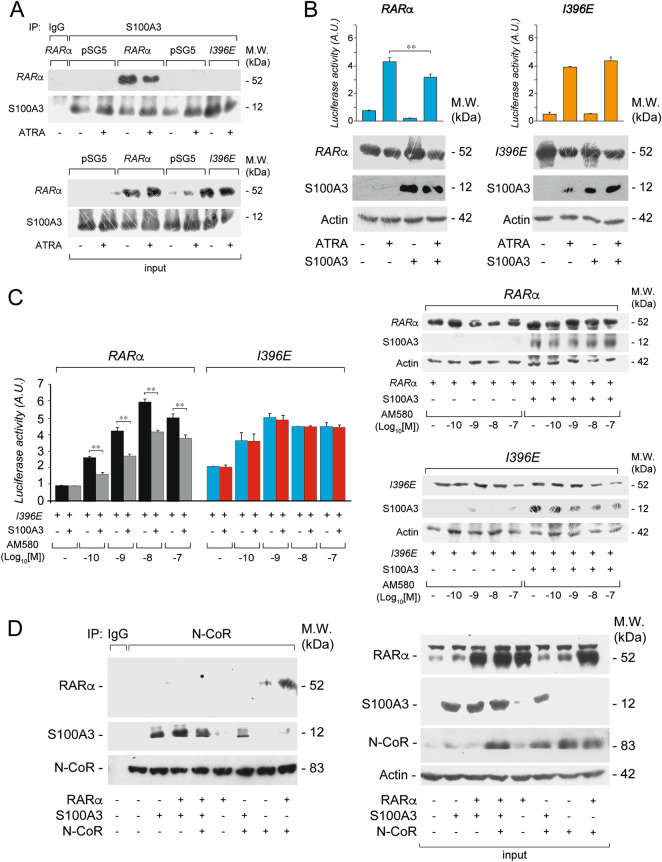
Fig. 4.
Interaction studies between S100A3, the RARα I396E mutant and the co-repressor N-COR. a COS-7 cells were co-transfected with equal amounts of wild-type RARα, I396E, and S100A3 expression plasmids, as indicated. The negative control for the experiments is represented by cells co-transfected with the void expression plasmid (pSG5). Twenty-four hours following transfection, cells were treated with vehicle (DMSO) or ATRA (1 µM) for 1 h. At the end of the treatment, total cell extracts were immunoprecipitated with anti-S100A3 mouse monoclonal antibodies (IP: S100A3). A further negative control for the immunoprecipitations is represented by the extracts of COS-7 cells co-transfected with pSG5 and the S100A3 expression plasmid which were challenged with non-specific immuno-globulins G (IP: IgG). Following normalization for the content of S100A3 in the input, the various immunoprecipitates were subjected to western blot analysis with anti-RARα antibodies. All the blots were subsequently re-challenged with anti-S100A3 antibodies, as indicated. Input = western blot analysis of the cell extracts before the indicated immunoprecipitation step. M.W. = molecular weights of the indicated proteins. Each immunoprecipitation is representative of at least two independent experiments providing the same type of results. b COS-7 cells were transiently co-transfected with an expression plasmid for the S100A3 cDNA (S100A3) or the corresponding void vector (pcDNA3), wild-type RARα and the RARα I396E mutant (I396E) along with a luciferase reporter construct controlled by a retinoid responsive element (β2RARE-Luc). Twenty-four hours following transfection, cells were treated with vehicle (DMSO) or ATRA (1 µM) for a further 24 h. Cell extracts were subjected to western blot analysis with anti-RARα (upper panels), anti-S100A3 (middle panels) and anti-actin (lower panels) antibodies. The same cell extracts were used for the measurement of luciferase activity, as illustrated by the bar graphs above the western blots. M.W. = molecular weights of the indicated proteins. c COS-7 cells were transiently transfected with the indicated expression plasmids as in (b). Twenty-four hours following transfection, cells were exposed to the indicated concentrations of the AM580 RARα agonist. Left: the bar graph illustrate the levels of luciferase activity. Each value is the mean ± SD of three replicate cultures. **Statistically significant comparison (p < 0.01, Student’s t-test). Right: the same extracts used for the determination of luciferase activity were subjected to western blot analysis with anti-RARα (upper panels), anti-S100A3 (middle panels) and anti-actin (lower panels) antibodies. d COS-7 cells were transiently co-transfected with the indicated combinations of S100A3, RARα, and a N-CoR fragment (aa. 1629–2453) containing the RARα-binding domains (NRI and NRII). Following normalization for the content of N-COR in the input, cell extracts were immunoprecipitated with an anti-N-COR antibody (IP: N-COR) or with non-specific immuno-globulins G (IP: IgG) and subjected to western blot analysis with anti-RARα, anti-S100A3, and anti-N-COR antibodies. Input = western blot analysis of the cell extracts before the indicated immunoprecipitation step. M.W. = molecular weights of the indicated proteins

