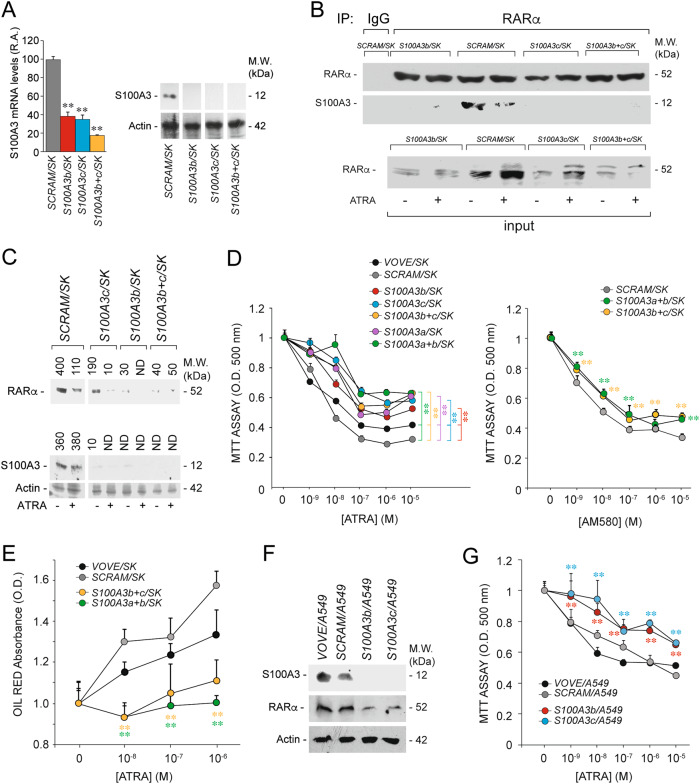
Fig. 5.
Functional studies in breast cancer SK-BR-3 and lung cancer A549 cells stably silenced for the S100A3 gene. a SK-BR-3 cells were stably infected with lentiviruses containing the following short hairpin RNAs: shSCRAM, shS100A3b, and shS100A3c or an equimolar combination of the two lentiviral vectors shS100A3b and shS100A3c. Infected cells were selected in puromycin for 10 days obtaining the following cell populations: SCRAM/SK, S100A3b/SK, S100A3c/SK, and S100A3b+c/SK. Left: the bar graph illustrates the relative S100A3 mRNA content determined by RT-PCR on total RNA extracted from the indicated cell populations grown under standard conditions. Each value is the mean ± SD of three independent cell cultures. Right: cell extracts from the indicated cell populations were subjected to western blot analysis using anti-S100A3 and anti-actin antibodies. Each line shows cropped lanes of the same gel, hence the results can be compared across the lanes, as they were obtained with the same exposure time. M.W. = molecular weights of the indicated proteins. b The indicated SK-BR-3 derived cell populations were treated with vehicle (DMSO) or ATRA (1 µM) for 1 h. At the end of the treatment, total cell extracts were immunoprecipitated with anti-RARα mouse monoclonal antibodies (IP: RARα). The negative control for the immunoprecipitations is represented by the extracts challenged with non-specific immuno-globulins G (IP: IgG), as indicated. Following normalization for the content of RARα in the input, the immunoprecipitates were subjected to western blot analysis with anti-RARα rabbit polyclonal antibodies and anti-S100A3 mouse monoclonal antibodies, as indicated. Input = western blot analyses of the cell extracts before the immunoprecipitation step. M.W. = molecular weights of the indicated proteins. c The indicated SK-BR-3 derived cell populations were treated with vehicle (DMSO) or ATRA (1 µM) for 24 h. Cell extracts were subjected to western blot analysis with anti-RARα, anti-S100A3, and anti-actin antibodies. The number above each lane indicates the results obtained after densitometric analysis of the bands and is expressed in arbitrary units. d SK-BR-3 cell populations stably infected with the void lentiviral vector (VOVE/SK), the scrambled negative control shRNA (SCRAM/SK), the indicated S100A3-targeting shRNA lentiviral constructs and combinations thereof were treated with vehicle and increasing concentrations of ATRA (left) or the RARα agoinist, AM580 (right) for 6 days. The growth of each cell population was evaluated with the use of the MTS assay. Each experimental point is the mean ± S.E. of four independent cell cultures. The MTS absorbance values of the S100A3b/SK, S100A3c/SK, and S100A3b+c/SK cell populations exposed to all the indicated concentrations of ATRA are significantly higher than the corresponding values determined for the VOVE/SK and SCRAM/SK counterparts (p < 0.01 according to a two-way Student’s t-test). With the exception of S100A3a+b/SK (10–6 M), the MTS absorbance values of the S100A3a+b/SK, S100A3b+c/SK cell populations exposed to all the indicated concentrations of AM580 are significantly higher than the corresponding values determined for the VOVE/SK and SCRAM/SK counterparts (**p < 0.01 according to a two-way Student’s t-test). e The indicated SK-BR-3-derived cell populations were treated with vehicle and increasing concentrations of ATRA for 6 days. The lactogenic differentiation state was determined with the use of the OIL-RED assay. Each experimental point is the mean + S.E. of four independent cell cultures. The OIL-RED absorbance values of the S100A3a+b/SK and S100A3b+c/SK cell populations exposed to all the indicated concentrations of ATRA are significantly lower than the corresponding values determined for the VOVE/SK and SCRAM/SK counterparts (**p < 0.01 according to a two-way Student’s t-test). f A549 cells were stably infected with a void lentiviral vector (VOVE) or lentiviruses containing shSCRAM, shS100A3b, and shS100A3c. Infected cells were selected in puromycin for 10 days obtaining the following cell populations: VOVE/A549, SCRAM/A549, S100A3b/A549, and S100A3c/A549. Cell extracts were subjected to western blot analysis with anti-RARα, anti-S100A3, and anti-actin antibodies. M.W. = molecular weights of the indicated proteins. g The indicated A549 derived cell populations were treated with vehicle and increasing concentrations of ATRA for 3 days. The growth of each cell populations was evaluated with the use of the MTS assay. Each experimental point is the mean ± S.E. of four independent cell cultures. The MTS absorbance values of the S100A3b/A549 and S100A3c/A549 cell populations exposed to all the indicated concentrations of ATRA are significantly higher than the corresponding values determined for the VOVE/A549 and SCRAM/A549 counterparts (**p < 0.01 according to a two-way Student’s t-test)

