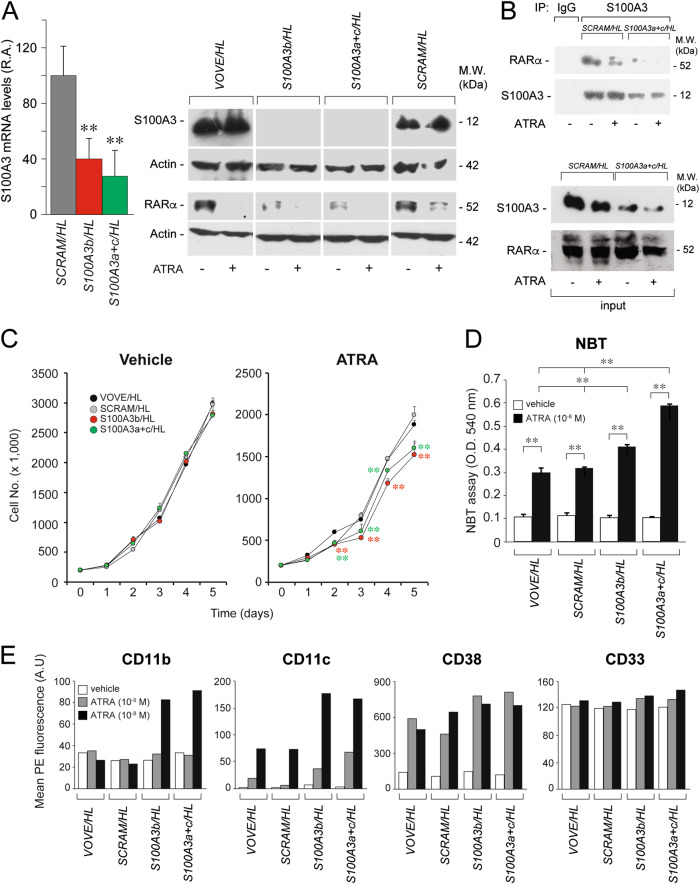
Fig. 8.
Functional studies in HL-60 cells stably silenced for the S100A3 gene. HL-60 cells were stably infected with lentiviruses containing shSCRAM, shS100A3b and an equimolar combination of the two lentiviral vectors shS100A3a+shS100A3c as well as the corresponding void lentivirus (VOVE). Infected cells were selected in puromycin for 10 days obtaining the following cell populations: VOVE/HL, SCRAM/HL, S100A3b/HL, and S100A3a+c/HL. a The indicated HL-60 derived cell populations were treated with vehicle (DMSO) or ATRA (10–6 M) for 24 h. Cell extracts were subjected to western blot analysis with anti-S100A3, anti-RARα and anti-actin antibodies. Each line shows cropped lanes of the same gel, hence the results can be compared across the lanes, as they were obtained with the same exposure time. M.W. = molecular weights of the indicated proteins. b SCRAM/HL and S100A3a+c/HL cells were treated with vehicle (DMSO) or ATRA (1 µM) for 1 h. At the end of the treatment, total cell extracts were immunoprecipitated with anti-S100A3 mouse monoclonal antibodies (IP: S100A3). The negative control for the immunoprecipitations is represented by the extracts challenged with non-specific immuno-globulins G (IP: IgG), as indicated. Following normalization for the content of S100A3 in the input, the immunoprecipitates were subjected to western blot analysis with anti-RARα and anti-S100A3 antibodies, as indicated. Input = western blot analyses of the cell extracts before the immunoprecipitation step. M.W. = molecular weights of the indicated proteins. c The indicated HL-60 derived cell populations were treated with vehicle and ATRA (10–7 M) for the indicated amount. The growth of each cell populations was evaluated by counting the number of viable cells. Each experimental point is the mean ± S.E. of three independent cell cultures. The cell number values of the indicated shRNA expressing cell populations exposed to vehicle or ATRA are significantly lower than the corresponding values determined for the VOVE/HL and SCRAM/HL counterparts (**p < 0.01 according to a two-way Student’s t-test). d The indicated HL-60 derived cell populations were treated with ATRA (10–8 M) for 5 days. Cells were subjected to the NBT assay. Each experimental point is the mean ± S.E. of three independent cell cultures. **Significantly higher (p < 0.01 according to a two-way Student’s t-test). e The indicated HL-60 derived cell populations were treated with vehicle or ATRA (10–8 M and 10–9 M) for 2 days. Cells were subjected to FACS analyses for the CD11b, CD11c, CD38, and CD33 surface markers, as indicated. The results are representative of two other independent experiments

