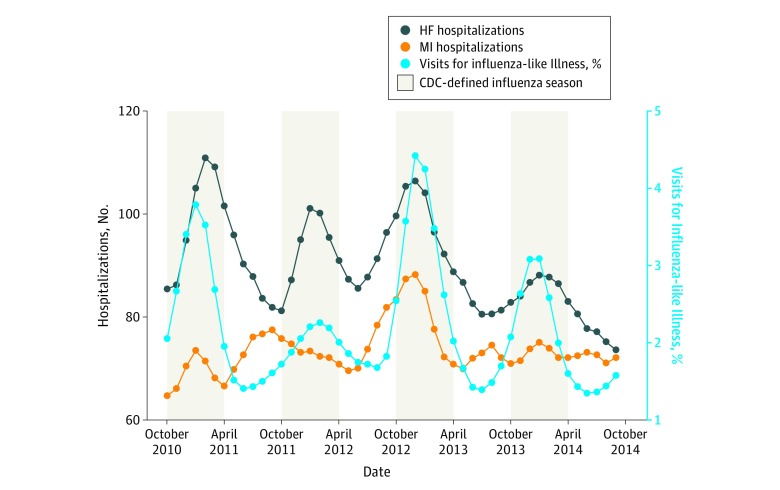
Figure 1. Average Influenza-like Illness Activity and Number of Hospitalizations Between October 2010 and September 2014.
This is based on moving averages that were calculated by taking the arithmetic mean of the observed values from each month with the values from the month before and after. CDC indicates Centers for Disease Control and Prevention; HF, heart failure; MI, myocardial infarction.

