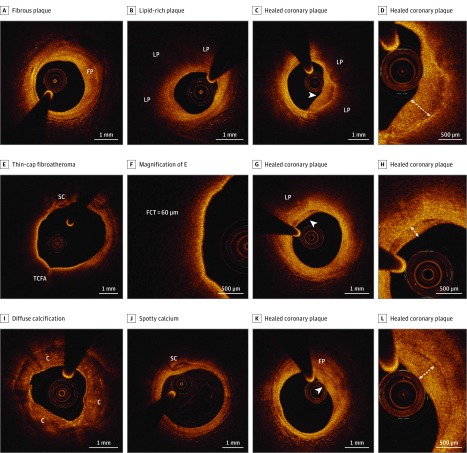
Figure 1. In Vivo Optical Coherence Tomography (OCT) Images of Coronary Plaque Features.
A, Fibrous plaque (FP), appearing as a plaque with homogeneous, high back-scattering signal. B, Lipid-rich plaque, characterized by a diffusely bordered signal-poor lipid pool (LP) extending for more than 90°. C and D, Healed coronary plaque, appearing as a heterogeneous, signal-rich layer of tissue (arrowhead) overlying a lipid-rich plaque; the layered pattern of the OCT signal (onionlike) is highlighted in the in high-power image in D. E, Thin-cap fibroatheroma, defined as a lipid-rich plaque with a fibrous cap thinner than 65 μm, with evidence of spotty calcium (SC). F, High-power image of E, showing a measured fibrous cap thickness (FCT) of 60 μm. G and H, Healed coronary plaque, characterized by a layered pattern of the signals (arrowhead) with underlying lipid plaque (LP). I, Diffuse calcification (C), appearing as a heterogeneous, signal-poor area delimited by sharp borders, extending along the entire circumference of the vessel wall. J, Spotty calcium (SC). K and L, Healed coronary plaque, characterized by a layered pattern of the signals (arrowhead) with underlying fibrous plaque (FP).

