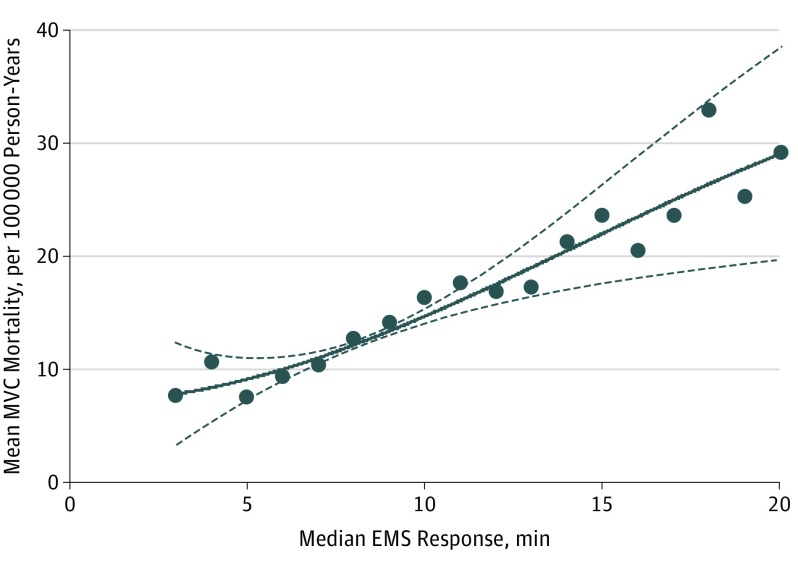
Figure 2. Crude Association Between County Median Emergency Medical Service (EMS) Response Time and County Rate of Motor Vehicle Crash (MVC) Mortality.
Blue circles represent the mean county MVC mortality rate associated with each incremental increase in county response time. Lines represent the best-fit polynomial to mean MVC mortality rates (solid line) and 95% CIs (dashed lines) associated with increasing county response times.

