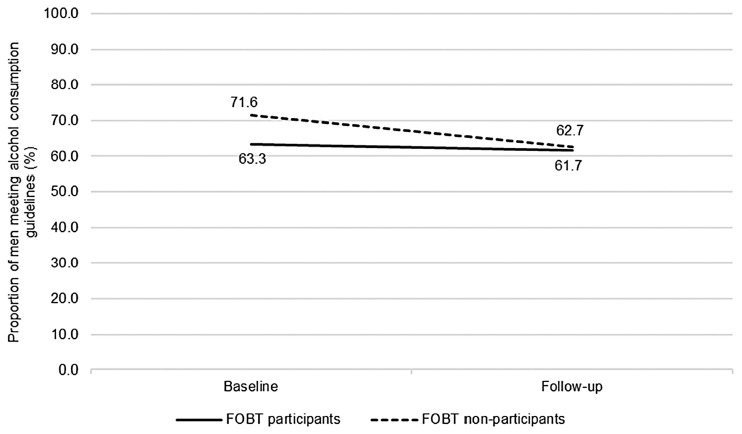
Figure 2.
Proportion of men meeting guidelines for alcohol consumption over time, comparing FOBT participants and FOBT non-participants (n = 714; FOBT participants n = 457, FOBT non-participants n = 257). Proportions adjusted for ethnicity, occupation, education, limiting long-standing illness, retirement status and baseline wave (missing data due to participant non-response).
FOBT: faecal occult blood testing.

