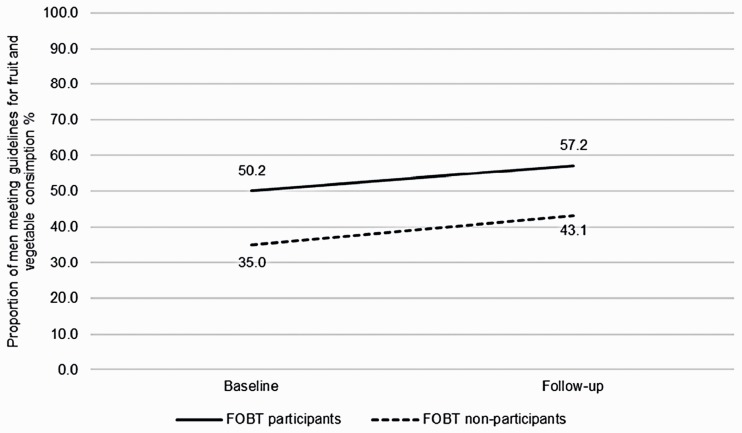
Figure 3.
Proportion of men meeting guidelines for fruit and vegetable consumption over time, comparing FOBT participants and FOBT non-participants (n = 524; FOBT participants n = 347, FOBT non-participants n = 177). Proportions adjusted for ethnicity, occupation, education, limiting long-standing illness, retirement status and baseline wave. This analysis includes a smaller sample size due to different, non-comparable items assessing fruit and vegetable consumption prior to wave 5.
FOBT: faecal occult blood testing.

